Journalist Report – December 17th

We are onto something, guys… Just this one more, and then we are golden!

Sol 9 began with the crew easing into the day between 7 and 9 AM. Rashi, the Crew Journalist, started her morning with some life planning, jotting down things she’d like to accomplish before the year wraps up. Peter, the Health and Safety Officer, was up by 7:30 AM and spent some quiet time reading a book. Spruha, our Crew Engineer, got straight to work at 7:45 AM, debugging the rover. She carefully checked each wiring connection on the circuit board to figure out why the power wasn’t flowing through properly. It turned out to be a loose connection, and Monish joined in to help troubleshoot. Together, they debated whether soldering was the best fix—it would secure the connection but make it harder to repair in the future. They decided to solder, and it worked.

Meanwhile, Hunter cleaned the kitchen before heading to the GreenHab to check on his experiment. Ian, Peter, and Rashi worked on their respective devices and research. As EVA time approached, Ian prepared a quick tuna spinach salad for everyone. Spruha, Ian, and Rashi got suited up while the rest of the crew helped them prep. Since the rover wasn’t ready for the EVA, Spruha removed a wheel to test it manually in the field. This was a walking EVA, so no rovers were used. The team exited from the RAM as planned and focused on testing the wheel, collecting stream measurements, and, as always, keeping an eye out for any interesting observations. Back at the Hab, Hunter and Peter handled comms, maintaining support for the EVA crew.

Once the EVA team returned, everyone settled in for snacks and Peter’s cognitive testing. Each crew member took turns completing the tests while Spruha and Monish continued their work on the rover. Rashi kept up with her documentation, and Ian and Hunter worked on their individual projects. As 6 PM approached, the team moved into the familiar routine of writing reports together before the comms window opened. Dinner was a collaborative effort: Hunter made Okonomiyaki with homemade barbecue sauce, and Monish prepared a hearty chicken soup.

The day was productive and filled with small wins, capped off with a shared meal and some downtime. With each passing sol, the crew continues to problem-solve, adapt, and move forward.

HSO Pre-Mission Checklist – December 22nd

HSO BEGINNING OF MISSION CHECKLIST 2024-2025

Submitted by: Ryan Villarreal

Crew: 306

Date: 22 December 2024

Part 1

Locate and confirm the emergency escape routes in the Hab are functional and clear:

  1. Stairs (between lower end upper deck)
    1. Stairs are functional and clear
  2. Emergency window (upper deck, east side)
    1. Emergency window is functional and clear
  3. Commander’s window (located in the commander’s crew quarter)
    1. The commander’s window is clear but NOT functional as indicated by mission control (Sergii) on 12/22/2024. In case of emergency, this window will be broken to allow evacuation.

Part 2

Inventory First Aid kit and note what needs to be refilled:

Science Dome First Aid Kit

6x exam gloves

1x triangular bandage

1x bandage shear

3x gauze roll

1x box of 12 safety pins

1x 4×4 bandage

1x Mylar rescue blanket

16x alcohol prep pad

Hab First Aid Kits

1x Sealed bleeding control kit

First Aid Kit in Metal Container on Wall

1x shears

1x tweezers

1x instant cold compress

1x eyewash solution

4x oval eye pad

1x 4×4 burn dressing

3x 3/4in x 3in bandaids

6x individual hand sanitizer gel

4x individual use burn cream

1x pair exam gloves

1x first aid tape

1x triangular bandage

1x disposable face shield

5x BZK antiseptic towelette

First Aid Supplies Inside Mirror

1x marker

1x box face masks

1x container floss picks

1x box individually wrapped ibuprofen

1x roll 4 in x 2.2 yards sports rap

1x flexible splint

3x triangular bandage

1x small gauze roll

1x roll of durapore adhesive

1x small roll sports wrap

1x 7cm x 4 m elastic bandage

1x container of Dramamine

1x pulse oximeter

1x thermometer

1x blood pressure monitor

1x 32 oz bottle isopropyl alcohol – 3/4 full

1x 16 oz bottle isopropyl alcohol – 1/2 full

1x 16 oz bottle hydrogen peroxide – 1/2 full

1x container of cotton swabs

2x 3/4 in x 4 in bandaid

x14 waterproof small bandaids

x4 small bandaids

x5 1 in x 3 in bandaid

EVA Safety Kit

1x tow rope

1x tourniquet

1x shears

1x marker

1x compression bandage kit

1x splint

x40 alcohol prep pads

1x 40cm x 60cm dressing

1x hemostatic bandage

2x antiseptic wipes

18x adhesive bandage, various sizes

1x container 4.5in x 4.1 yards compressed bandage

2x thermal blanket

Part 3

Note any safety issues:

  1. A crewmember will be using needles and syringes as part of their research. However, they do not have a proper sharps disposal container. This is a potential safety hazard. For the time being, the individual has been trained on proper capping/uncapping procedures for needles, and will keep needles capped in a separate location until a more permanent solution can be found.
  2. After testing the downstairs carbon monoxide detector, it began beeping periodically indicating a low battery. No replacement batteries were located in the HAB, so extra 9V batteries have been requested from mission support.

Note any health/environmental issues: None noted.

Note any missing or recommended health and safety supplies:

  1. Sharps disposal container for used needles
  2. 9V batteries for smoke and carbon monoxide detectors
  3. Antibiotic ointment (individually wrapped) are needed for the lower HAB first aid kit
  4. An AED would be standard safety supply which is not present
  5. A dedicated tourniquet for the HAB would be a welcome addition, in case the EVA safety kit is out on EVA

Part 4. Using the attached Safety Equipment Inventory, locate, test and confirm operation of all safety equipment. List any equipment not found and/or missing. See notes on the next page.

All safety equipment from the below Safety Equipment Inventory matrix has been checked for functionality. Please note that the matrix does not indicate a nightlight in the RAM, but the accompanying Safety Equipment Notes and Locations list indicates a night light exists in the RAM. Upon inspection, no night light was found in the RAM.

Safety Equipment Inventory

HAB Upper deck HAB Lower deck RAM GreenHab ScienceDome Rovers
Escape ladder X
Eyewash X
Fire blanket X X X
Fire extinguisher X X X X X
First Aid X X
Intercom X X X X
Radios (Channels 10 and 22) X X X X X
Nightlight X X X
Carbon Monoxide alarm X X X X X
Smoke alarm X X X X X
Propane alarm X X
EVA Safety Kit X

Mission Plan – December 22nd

Crew 306 – Montes
Dec 22th, 2024 – Jan 4th, 2024

Crew Members:
Commander: Jesus Meza-Galvan
Crew Engineer: Keegan Chavez
Crew Geologist: Elizabeth Howard
Health and Safety Officer: Ryan Villarreal
Green Hab Officer: Adriana Sanchez
Crew Journalist: Rodrigo Schmitt

Mission Plan:
Crew 306, “Montes”, is the twin mission of Crew 305, “Valles.” Valles and Montes are the eighth and ninth crews invited to MDRS from Purdue University. The naming conventions are meant to evoke the popular song by Tammi Terrell and Marvin Gay, which says: “Ain’t no mountain high enough. Ain’t no valley low enough.” The song lyrics literally express the crew member’s desire to one day explore the tallest mountains and deepest valleys on Mars. More importantly, the song highlights the spirit of perseverance that Valles and Montes bring to MDRS. We aim to continue Purdue University’s “Boilermaker” tradition of determination and grit in the advancement of science, technology, and mission protocols in service to future space missions. Montes will perform several experiments related to the long-term survival of a manned Mars station. We will address the need for mapping and scouting terrain using a drone based lidar system. We will address the need for sustainable waste management using fungi to break down and upcycle resources that would otherwise be lost. We will address the need for crew and station health monitoring by implementing both wearable health monitors, and environmental sensors placed throughout the station. We will address the need for in-situ resource utilization by collecting semiconductive materials from the environment and attempting to make photo-voltaic cells. And finally, we will perform geological research by measuring the subsurface magnetic properties us the surrounding environment.

The main objectives of the Montes analog Mars simulation are:
Keeping the highest level of fidelity and realism in the simulation. Earth analogs cannot reproduce Martian gravity and atmosphere, but the crew will keep every other aspect into consideration. This includes safety and research protocols, definition of roles and daily schedule, EVA protocols (and limitations), communication protocols, fruitful collaboration with the program director and mission support, and adaptation to limited resources and environmental difficulties.
Performing research in the fields of geology, engineering, human factors, and crew operations on Mars.
Experimenting with personnel at Purdue, providing a simulated mission control center to coordinate and support research and operations (including delay in communication, to simulate Earth-Mars distance).
Continuing the fruitful collaboration of Purdue crews with the MDRS program.
Following the mission, supporting MDRS with useful results for future crews.

Crew Projects:

Title: LIDAR-Enhanced Drone Simulations for Mars EDL Operations
Author: Rodrigo Schmitt
Objectives: Demonstrate the use of drone-based Lidar to perform local mapping of the terrain.
Description: This project investigates the application of drone-based LIDAR systems for improving Entry, Descent, and Landing (EDL) operations on Mars. Utilizing LIDAR technology, the study will focus on collecting high-resolution topographic data of the Martian-like terrain at MDRS to create detailed elevation and obstacle maps. These maps are essential for identifying potential landing zones and recognizing surface hazards that could impact the safety and success of landing operations. The research will utilize drones equipped with LIDAR sensors to simulate the scanning and mapping process during the descent phase of a Mars mission, aiming to provide actionable data that enhances landing strategies.
Rationale: EDL phases are critical and high-risk segments of space missions, particularly on planetary bodies like Mars, where the atmosphere and surface conditions can greatly affect the landing dynamics. Current Mars missions rely on pre-existing orbital data, which may not capture minute but critical topographical changes. By developing a method to rapidly and accurately assess landing zones up to the last moments before touchdown, the safety and precision of landings can be significantly improved.
EVAs: 6.

Title: Subsurface Magnetic Properties of the Martian Environment
Author: Elizabeth Howard
Objectives: Study geological magnetism to develop test procedures for future missions.
Description: The crew geologist will work to develop and test procedure(s) for studying magnetic behavior of subsurface Martian rocks that would be useful to have humans/astronauts perform, and correlations to possible influencing factors such as solar wind activity. Such research is relevant when attempting to study and understand Mars as we understand Earth, and in addition to giving insight as to which theories about the Martian environment may be supported by data, real Mars missions can allow scientists to develop more accurate planetary and orbital models of Mars.
Rationale: In recent years, NASA’s JPL facility has developed a project called InSight, a Martian environment studying lander. InSight, equipped with magnetometers to study the seismology of rocks on the Martian surface, picks up on magnetic pulse jumps around midnight. One theory for explaining this is that the pulses may be “related to the solar wind interacting with the Martian atmosphere”, although literature from the InSight team assessing data from Mars orbiter MAVEN is inconclusive on this. On Earth, we have the advantage of direct access to setups necessary to make in depth planetary characterizations.
EVAs: 4-5 EVAs

Title: Waste Management Solutions for Space Habitats: Utilizing Mycoremediation
Author(s): Adriana Sanchez
Objectives: Advancing the TRL of mycoponics™ technology by accessing transportability, and survivability of blue oyster fungi (Pleurotus ostreatus var. columbinus).
Description: This research aims to test the use of mycotechnology for waste management in a simulated analog habitat. Using different species of fungi, waste generated by the crew can be broken down instead of disposed of at the end of the simulation. Recycling wastes that are predicted to be created on Mars can help get closer to creating self-sustaining architecture, the key to inhabiting Mars. Using a liquid substrate to suspend the waste for Pestalotiopsis microspora, a plastic digesting fungus, and Coprophilous fungi, a dung mushroom-forming fungi, to digest and fruit, will allow for testing of edibility and the effectivity of upcycling disposable waste in a simulated setting.
Rationale: Lack of advanced bioregenerative life support systems is a critical challenge for long term space missions and establishing bases beyond Earth’s biosphere. Similar wastes generated on the ISS and at MDRS are either jettisoned off into deep space or collected and disposed of after missions. This takes away from the reality of what conditions we will face in deep space.
EVAs: None.

Title: Fabrication of photovoltaic cells using semiconductor material gathered In-Situ.
Author(s): Jesus Meza-Galvan
Objectives: Gather iron and Iron-oxide containing minerals from the environment to use as semiconducting material to fabricate a rudimentary dye-sensitized solar cell.
Description: The project will focus on the fabrication of Dye-sensitized solar cells using semiconducting metal-oxides that will be generated from station resources and minerals collected during EVAs. The basic requirements are glass slides, a graphite pencil, a photo-active pigment (dye), metal electrodes (aluminium cans), a semiconducting material, and an electrolyte solution. Most of the components required for a Dye sensitized cell are part of standard crew supplies. For the electrolyte solution, an Iodide compound works best, such as over the counter Iodine Tincture used for wound disinfecting. Of interest to this mission will be Copper Oxide (CuO), Iron Oxide (FeO, Fe2O3), and Titanium Dioxide (TiO2). TiO2 is often used as a pigment in paint, or as food coloring in frosting and powdered sugar. It is also the most common active ingredient in sunscreen. For this mission, we will be extracting TiO2 from sunscreen by baking it in an oven or hot plate. Copper oxide will be generated from copper sheets which will be brought in along with the crew. These sheets will be oxidized under high heat using the ovens in the science dome. The surface layer of oxide will be scrapped off to create semiconductive powder that will be spread over the glass slide. Iron oxide containing minerals will be collected while on EVA. The primary target of these EVAs will be hematite, as it has been shown that hematite powder can be refined to produce a solar cell.
Rationale: To establish a sustained presence on Mars, technologies for power generation will be necessary. Although Dye-sensitized cells are rudimentary and not the most efficient, they have the advantage of being easy to manufacture and can potentially be constructed using In-situ resources.
EVAs: 6

Title: Sensor-based Team Performance Monitoring in Isolated, Confined, and Extreme Environments
Author(s): Ryan Villarreal
Objectives: To take team-level measurements of team performance in isolated confined and extreme environments.
Description: This study aims to investigate team-level physiological synchrony from wrist-worn photoplethysmography (PPG) using multi-dimensional recurrence quantification analysis (MDRQA) and team workload questionnaires to understand interpersonal relationships. In ICE environments, teams face unique challenges that impact their performance, stress levels, and mood. Current methods for assessing team effectiveness rely on subjective self-reports and expert evaluations, which are prone to biases. Physiological synchrony, the alignment of physiological responses among team members, has been suggested as a potential objective measure of team dynamics but has not been studied in ICE contexts.
Rationale: In isolated, confined, and extreme (ICE) environments, teams face unique challenges that impact their performance, stress levels, and mood. Current methods for assessing how teams are performing rely on subjective self-reports and expert evaluations, which are prone to biases. Physiological synchrony, the alignment of physiological responses among team members, has been suggested as a potential objective measure of team dynamics. Physiological synchrony has been shown to predict team performance and mood among team members. In ICE environments, these constructs are crucial for mission success.
EVAs: None

Title: MDRS Monitoring System
Author(s): Monish Lokhande, Keegan Chavez
Objectives: The project is focused on developing a network of Raspberry Pis to measure data from various locations in the habitat to measure the ambient conditions. This will be a continuation of the project initiated by Crews 288, 289, and 305.
Description: The crew will be making a network of Raspberry Pis to measure data from various locations in the habitat to measure including CO2, VOC, Air Quality, Temperature and Humidity levels. This data would be collected and analysed for any possible sudden changes. The primary problem to be solved is monitoring multiple sensors remotely, as the current dashboard does not allow more than 10 channels active at once. The goal is to integrate up to four sensor payloads together, one for each station module, to be interfaced remotely by Purdue Mission control.
Rationale: Equipment and system health monitoring is an important aspect for long duration missions on Mars. Loss of any equipment or failure of the system on Mars is a massive danger for crews, as transporting any material takes at least eight months of lead time. Also, communication with the Martian habitat has up to a 21-minute delay. Hence, any emergencies need to be detected and solved locally. Therefore, in-house technology to monitor and potentially identify any possible hazardous situations is vital.
EVAs: None

Title: Wearable-Based Autonomic Profiles for Real-Time Cognitive Monitoring in Spaceflight
Author: Peter Zoss, Ryan Villarreal
Objective: This study will longitudinally quantify individual changes in autonomic nervous system (ANS) status via a wearable sensor in MDRS crew members to understand how our autonomic activity is associated with sequential measures of cognitive performance for predictive model development.
Description: Crew 306 will continue the project as proposed by Peter Zoss and Crew 305.
Rationale:
EVAs: None required

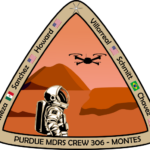
Bios, photos and mission patch – December 22nd

Crew Commander
Jesus Meza-Galvan is a PhD candidate in the School of Aeronautics and Astronautics at Purdue University, and a second time MDRS analog astronaut. Jesus served as Engineer for Crew 288 – Phobos and will now serve as Commander for Crew 306 – Montes. Prior to starting his PhD, Jesus worked as an applied physicist for a technology R&D company. His background is in solid-state physics and nano/microfabrication of semiconductor and optical devices. His PhD research is focused on developing MEMS micro-propulsion systems for small satellites. When he grows up, Jesus wants to be a spacecraft engineer working to develop instrumentation for science missions and tools for in-space manufacturing. He aspires to help Will Smith and Jeff Goldblum upload computer viruses onto the alien mothership.

Crew Engineer
Keegan Chavez is a second year Master’s student in the Electrical Engineering department at Purdue, his research focuses on photonic integrated circuits. He has a broader interest in researching and developing technologies that will aid in human exploration and settlement of space. Keegan’s long-term goal is to become an astronaut and be a part of a mission to settle Mars. His home town is Albuquerque, New Mexico. His hobbies include soccer and cycling.

Health and Safety Officer
Ryan Thomas Villarreal is a third year Ph.D. student at Purdue University with a multidisciplinary background passionate about analyzing and gaining a deeper knowledge of how humans interact with their environment, their technologies, and the others around them. Ryan seeks to utilize experience in software, embedded systems, and human factors to conduct research and gain insights into human behavior and physiology that inform the design of safety-critical human spaceflight systems.

GreenHab Officer
Adriana Sanchez is an Undergraduate Student studying Mechanical Engineering Technology at Purdue University with a passion for sustainability, space exploration, and innovative food production systems. Her current research focuses on advancing MycoponicsTM technology to support food production and to tackle waste management. Adriana is deeply committed to using science and innovation to help bridge gaps and build inclusive opportunities. She is working towards her goal of becoming an Astronaut. For crew 306, Adriana will focus on advancing the TRL of MycoponicsTM and test waste-made nutrient media for mushroom cultivation. Outside of her academic pursuits, she is Team Captain/Coach for the Purdue Women’s Wrestling Club and will be leading them in their very first competition this upcoming January. In her free time, she creates art, collects plants, and explores new places.

Crew Journalist
Rodrigo Schmitt, is an astrophysicist, space engineer, and a PhD candidate in Space Systems Engineering at Purdue University. Rod also co-founded SEARCH, the first organization at Purdue dedicated to analog astronautics. At the moment, Rod’s research focuses on exploring designs of innovative space systems using Kerbal Space Program as a simulation environment, while applying AI methods to understand how to better optimize lunar mission architectures. As the Crew Journalist of Crew 306 – Montes, his research explores the use of drones and LIDAR to map the terrain of MDRS. His vision of going to space first started with the show Space Brothers, where the brothers Mutta and Hibito go through the struggles of astronaut training, flight tests, and wilderness survival to reach the Moon. In his free time, he enjoys outdoors activities like hiking, as well as instrumental music and philosophical books.

Crew Geologist
Elizabeth is a master’s student in the astrodynamics department at Purdue aerospace with a background in biosystems engineering. She is interested in contributing to robotic and manned space exploration and ultimately wants to work in mission operations. By participating in MDRS, her goal is to gain a better understanding of what astronauts go through during their missions to be a better flight controller someday. Her research will focus on developing a standard operating procedure for studying geophysical properties such as subsurface magnetism during future planetary missions.

Supplemental Operations Report – December 21st

Date: 12/21/2024
Name of person filing report: Sergii Iakymov
Reason for Report: Routine
Non-Nominal Systems: Power system battery, Curiosity rover.

Power system: Solar: The battery bank does not hold charge when sun is down and low on the horizon. Main generator has been monitored for oil leaks; none or extremely minor leaks observed.
Main generator:
1) Oil, oil filter changed on 12/16/2024.
2) Current hours – 7500.4

Propane Readings:
Refilled on 12/17/2024
Station Tank: 78%
Director Tank: 80%
Intern Tank: 81%
Generator Tank: 67%

Water:
Hab Static Tank – 550 gallons
GreenHab – 190 gallons
Outpost tank – 300 gallons

Rovers:
Sojourner rover used: No
Hours: 206.6
Beginning Charge: 100 %
Ending Charge: 100 %
Currently Charging: Yes
Notes on Rovers: Curiosity left rear tire is airing out and need to be taken to a shop.

Cars:
Hab Car used and why, where: To Hanksville for supplies.
Crew Car used and why, where: To Grand Junction and Hanksville by crew.
General notes and comments: Sway bar end links or bushings on Crew Car are failing, causing major swaying motion while driving.

Summary of Internet: Outpost router disconnects from the network from time to time. Reasons unknown.

EVA suits and radios: Suits: All nominal.
Comms: All nominal.

Campus wide inspection, if action taken, what and why: All nominal.
Summary of Hab Operations: Additional probe installed in the toilet tank for the sound alarm to avoid interference with the tank level sensors.
Summary of GreenHab Operations: All nominal.
Summary of SciDome Operations: Door sensor installed and integrated.
Summary of Observatories Operations: All nominal.
Summary of RAM Operations: All nominal.
Summary of Outpost Operations: All nominal.
Summary of Health and Safety Issues: All nominal.

Mission Summary- December 20th

Mars Desert Research Station

Mission Summary

Crew 305 – Valles

Dec 8th, 2024 – Dec 21st, 2024

Crew Members:

Commander and GreenHab Officer: Hunter Vannier

Executive Officer and Crew Geologist: Ian Pamerleau

Crew Engineer: Spruha Vashi

Crew Scientist: Monish Lokhande

Health and Safety Officer: Peter Zoss

Crew Journalist: Rashi Jain
AD_4nXfHxOpgYmoEUfJwZhkYarSPIAiot7Y4j0S78PNzNPrvof_37AdngoxlY_hYkZaiycWqP-jeGNO5ObM_CY2sPKsm3aedgG3XQIbW2PxV64njaWSd-kMbYIlSM10pXnTNadcUNuJT?key=UDBElswbanx1w2tkCIONab5X

Acknowledgements:

The MDRS 305 crew would like to express their gratitude to the many people who made this mission possible: our deepest thanks to Dr. Robert Zubrin, President of the Mars Society; Sergii Iakymov, MDRS Director, who assisted us with planning and answered many questions in the months prior to the mission, along with support at the end of our mission; Ben Stanley (and Jules), MDRS Analog Research Program Director and David Steinhour, MDRS Site Manager for being invaluable as Mission Support during the mission and addressing both large and small problems during our stay; Mike Stolz for patience and consistent communication regarding media relations; Russ Nelson for preparing us for emergencies; Scott Davis for EVA suit support; James Burk, Executive Director; Peter Detterline, Director of Observatories; Bernard Dubb, MDRS IT coordinator; Dr. Kshitij Mall and the Purdue Mission Support staff; the Purdue faculty who greatly helped us in the selection process of Crews 305 and 306 (Valles and Montes); all the departments and people at Purdue University who supported this mission; and all the unnamed people who work behind the scene

to make this effort possible, and who gave us a chance to be an active part of the effort towards human exploration of Mars.

Mission description and outcome:

MDRS 305 “Valles”, twin of mission 306 “Montes”, is the eighth all-Purdue crew at MDRS. The mission was characterized by excellent research quality that was diverse yet compatible with one another. We had a high level of performance from a professional and a personal perspective. The diverse crew included two women and four men, and represented three countries (United States, India, Canada) as well as various departments at Purdue. Crew 305 is an all-student crew (undergraduate student, PhD students and candidates), showcasing the strength of Purdue student-lead research in the field of space exploration.

Crew 305 performed a wide range of research tasks with a strong geological and human-machine compatibility focus that regularly led to collaborative research efforts, a primary Crew 305 theme. EVAs led crew members to areas of MDRS that yielded numerous high-quality geologic samples and scientific data collection. Crew members were able to observe EVA activities and leave with a better understanding of how machines can be effectively used to help astronauts on Mars. Engineering, health tracking, and botany experiments concerned with Mars exploration were also successfully conducted, including how MDRS operations affected the health and well-being of the crew during versus prior to the mission. The privilege of sending two Purdue crews back-to-back is not lost on us, as multiple experiments will live on during the Crew 306 “Montes” mission to follow.

MDRS’s unique analogue environment and robust campus was both impactful and relevant for Crew 305, as almost every building was in use during the mission. Much of the research conducted here would not have been possible in typical terrestrial environments or in college facilities. This work will directly contribute to PhD dissertations and future conference presentations that, in turn, will no doubt spread awareness about MDRS missions and foster awareness and passion for space exploration.

Mission description and outcome:

MDRS 305 “Valles”, twin of mission 306 “Montes”, is the eighth all-Purdue crew at MDRS. The mission was characterized by excellent research quality that was diverse yet compatible with one another. We had a high level of performance from a professional and a personal perspective. The diverse crew included two women and four men, and represented three countries (United States, India, Canada) as well as various departments at Purdue. Crew 305 is an all-student crew (undergraduate student, PhD students and candidates), showcasing the strength of Purdue student-lead research in the field of space exploration.

Crew 305 performed a wide range of research tasks with a strong geological and human-machine compatibility focus that regularly led to collaborative research efforts, a primary Crew 305 theme. EVAs led crew members to areas of MDRS that yielded numerous high-quality geologic samples and scientific data collection. Crew members were able to observe EVA activities and leave with a better understanding of how machines can be effectively used to help astronauts on Mars. Engineering, health tracking, and botany experiments concerned with Mars exploration were also successfully conducted, including how MDRS operations affected the health and well-being of the crew during versus prior to the mission. The privilege of sending two Purdue crews back-to-back is not lost on us, as multiple experiments will live on during the Crew 306 “Montes” mission to follow.

MDRS’s unique analogue environment and robust campus was both impactful and relevant for Crew 305, as almost every building was in use during the mission. Much of the research conducted here would not have been possible in typical terrestrial environments or in college facilities. This work will directly contribute to PhD dissertations and future conference presentations that, in turn, will no doubt spread awareness about MDRS missions and foster awareness and passion for space exploration. Figure 1. MDRS 305 Crew posing in front of the habitat. Left to right: Executive Office and Crew Geologist Ian Pamerleau, Health and Safety Office Peter Zoss, Commander and GreenHab Officer Hunter Vannier, Crew Journalist Rashi Jain, Crew Engineer Spruha Vashi, and Crew Scientist Monish Lokhande.

It has been a pleasure to be commander of this crew, which successfully completed a wide variety of high level research while sharing many laughs along the way. I was particularly impressed by the empathy and major effort crew members committed to help fellow crewmates be as successful as possible with research,

which included a 4-day soldering, wiring, and coding saga. We experienced significant technical challenges, but everyone took immediate action and worked the problems together. At MDRS, the crew properly followed safety and research protocols, performed as a tight group, and used their time productively. Crew 305 expressed genuine interest in learning about the diverse backgrounds and research interests represented by the group, which made for a more meaningful and fulfilling experience.

Figure 1. MDRS 305 Crew posing in front of the habitat. Lef to right: Executive Office and Crew Geologist Ian Pamerleau, Health and Safety Office Peter Zoss, Commander and GreenHab Officer Hunter Vannier, Crew Journalist Rashi Jain, Crew Engineer Spruha Vashi, and Crew Scientist Monish Lokhande.

It has been a pleasure to be commander of this crew, which successfully completed a wide variety of high level research while sharing many laughs along the way. I was particularly impressed by the empathy and major effort crew members committed to help fellow crewmates be as successful as possible with research,

which included a 4-day soldering, wiring, and coding saga. We experienced significant technical challenges, but everyone took immediate action and worked the problems together. At MDRS, the crew properly followed safety and research protocols, performed as a tight group, and used their time productively. Crew 305 expressed genuine interest in learning about the diverse backgrounds and research interests represented by the group, which made for a more meaningful and fulfilling experience.

Summary of ExtraVehicular Activities (EVA)

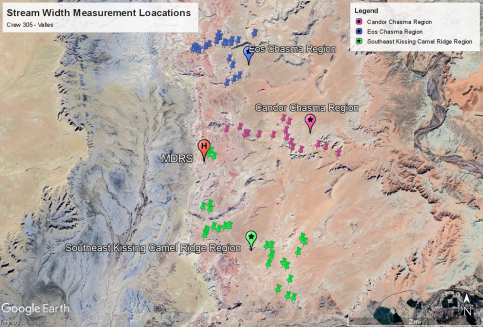
After being trained in the use of rovers and in the safety protocols for EVAs, the crew had twelve excursions during rotation 305. Two of which were the traditional short EVAs to Marble Ritual, and the remaining EVAs were aimed at gathering data, samples, or observations for one or more crew members’ research. The EVAs reached locations that featured ephemeral streams for measuring and/or paleosol for sampling. Observations were also taken on how machines could aid astronauts taking data in the field. EVA teams thoroughly explored the regions in Candor Chasma, Eos Chasma, southeast of Kissing Camel Ridge (KCR), and east of Hab Ridge (Fig. 2).

While the EVA team was in the field taking data, the rest of 305 were still involved in the EVA. Every Crew 305 member would meet in the lower Hab about 30 minutes before the EVA began to help those gearing up get ready and enter the airlock (and always took airlock photos). During the EVA, in addition to 45-minute check-ins, the comms team back at the Hab would take notes on the EVA team’s movements including time they parked the rovers, time they began the return trip to the Hab, and any additional information. This information was logged in an EVA spreadsheet that we are leaving as a template for future crews to use. The comms team also was able to use the GPS trackers on the EVA team to help them find their desired location in real time. The comms team was able to advise the EVA team on an accessible route into Eos Chasma during EVA 05. Overall, Crew 305 had a very safe and successful time in the field for multiple crew members’ research projects.

Table 1. Summary of EVAs, indicating Sol of execution, the destination of each EVA, time spent walking and taking measurements/ samples/observations, total time, walking distance, and total distance.

EVA

Sol

Destinations

Walking & Activity Time (h:mm)

Total Time (h:mm)

Walking Distance (km [miles])

Total Distance (km [miles])

1

1

Marble Ritual

0:45

1:00

1.32 [0.82]

1.87 [1.16]

2

1

Marble Ritual

1:00

1:15

1.48 [0.92]

2.03 [1.26]

3

2

Candor Chasma

2:45

3:05

3.25 [2.02]

6.25 [3.88]

4

3

Compass Rock/ Candor Chasma

3:10

3:45

4.63 [2.88]

12.08 [7.50]

5

5

Eos Chasma

3:10

3:30

5.41 [3.36]

10.95 [6.80]

6

6

Eos Chasma

2:15

2:45

2.93 [1.82]

11.15 [6.93]

7

7

Zubrin’s Head/ White Rock

Canyon

2:15

2:55

4.46 [2.77]

11.58 [7.20]

8

8

Hab Ridge/

Zubrin’s Head

2:55

3:25

4.42 [2.74]

11.54 [7.17]

9

9

North of Hab

1:25

1:25

2.22 [1.38]

2.22 [1.38]

10

10

South KCR

1:45

2:15

2.40 [1.49]

6.72 [4.18]

11

11

East Zubrin’s

Head/White Rock Canyon

3:25

2:55

3.42 [2.13]

12.92 [8.03]

12

Total

12

Compass Rock

1:15

26:05

1:40

29:55

1.24 [0.77]

37.18 [23.10]

7.96 [4.95]

97.27 [60.44]

AD_4nXdH0BZ174DcQvdKGTqUWEDzCnyf9aZPVdBoApbgwwH7yzjF5ZdZUXdy75MQcW-OLyW1LpAe00zjvVsDu5pIGnLHI_WUd4AEHn_gTQYvIIZx4W5jbWG00XOWTsd-K9G45gvYc8LF?key=UDBElswbanx1w2tkCIONab5XFigure 2. Satellite map of the three regions explored by Crew 305 – Valles. There were 3 EVAs spent in the drainage basin of Candor Chasma (purple pins), 2 in the drainage basin of Eos Chasma (blue pins), and 4 in the drainage basin Southeast of Kissing Camel Ridge (green pins).

Summary of GreenHab Activities

Crew GreenHab Officer: Hunter Vannier

It was truly a pleasure working in the GreenHab and learning how to most efficiently care for its residents, which are all happy and healthy. During the mission, the cucumbers were the most dramatic and required twice-daily watering to prevent wilting. Many cucumbers have appeared over the past two weeks, though they are not mature enough to indulge in before our departure, and cherry tomatoes appeared on our last afternoon. The greatest change to the GreenHab was the transplanting and thinning of tomatoes. Now each pot only has one tomato to ensure healthy growth, proper fruiting, and to improve current and future water efficiency. Two raised beds were refreshed with new soil and planted with six different types of microgreens. These will also have to be enjoyed by future crews. The crew was able to enjoy almost daily use of crops in meals, including sauteed arugula, carrot green salad, regular use of cilantro in a variety of meals, and basil, thyme, and parsley in spaghetti sauce. On our final day, we even got to harvest a cucumber. Aside from the general care of the GreenHab, I was able to successfully carry out a soil moisture monitoring experiment to improve water efficiency for the growth of microgreens (see below in Science Summary section). Below I will share a watering schedule for the current set of crops.

Recommended watering schedule: tomatoes, distribute 2-3 gallons among tomatoes every 2 days; cucumbers, 1 gallon in the morning and 1 gallon in evening; raised microgreen beds, 50 oz per morning; radish and carrot bin, ½ gallon every 3 days; herb raised bed, 1.5 gallons every 5 days.

Science Summary

We had 7 separate projects that covered a range of topics. Some of them were EVA-related, while others were conducted at MDRS campus. Overall, each project uniquely highlighted each crewmember’s strength and expertise, and expanded scientific, engineering, and human factor knowledge to support crewed exploration of Mars.

Research Projects:

1.

Title: Hydraulic Geometry of Ephemeral Streams to Potentially Elucidate Paleoclimate Author: Ian Pamerleau

Description, activities, and results: Ephemeral streams are present around the MDRS campus and carve out the landscape after heavy rain. The hydraulic geometry of these streams mathematically describes how the width and drainage area change as the flow moves up- to downstream. There is a range of values that the hydraulic geometry of rivers tends to fall within, which tells us more about climate, lithology, and sediment load. These values have been established for the more “mature” rivers with constantly flowing water. However, the ephemeral streams at MDRS may not have achieved the values present in the literature. I will test if the ephemeral streams of MDRS hold the same hydraulic geometry in the literature, and if it is able to tell us anything about the climate.

We were able to thoroughly explore the three major areas where I wanted to take stream width measurements: Candor Chasma, Eos Chasma, and the region southeast of Kissing Camel Ridge (KCR) (Fig. 2). My objective was to take measurements of branching tributaries and between said tributaries along a main channel because the drainage area of a channel will substantially increase when the area of another stream is added. We also took three measurements of the stream width at each location a meter or so apart from one another to get an average width of the location.

I have not been able to create a plot of my data yet and am still in the processing stage. The trend I expect to see (i.e., smaller drainage area locations yield smaller stream widths and larger drainage area locations yield larger stream widths) will likely hold based on my observations and preliminary processing. The data may become a bit more complicated when comparing two sections of high drainage area, however, as there seemed to have been some variability in different factors such as lithology, slope, vegetation, etc.. I tried to limit these factors based on the location I chose but it is impossible to fully eliminate them, but I have taken photos of each location we took measurements of to better analyze any anomalies. I will hopefully be able to discuss these results with my undergraduate research advisor (whom I have worked on a geomorphology project with) or a geomorphologist/hydrologist at Purdue and share my findings at a conference once the analysis has been completed.

2.

Title: Effect of Variable Soil Moisture on Microgreen Growth

Author(s): Hunter Vannier

Description, activities, and results: Efficient plant growth is an important element of life at MDRS and will be critical for sustainability if we want to create a self-sustaining presence on other planetary bodies. For this project, I aimed to conduct an experiment that investigated how soil moisture content affects microgreen growth to find efficient watering practices. The established GreenHab infrastructure at the Mars Desert Research Station is an ideal place to conduct this experiment.

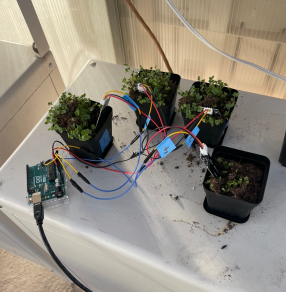
Experimental setup: I filled four 3” x 3” potting containers with Miracle Grow potting soil available in the GreenHab. The soil required priming and mixing with water, so the pots started out with some moisture level. In each of the pots, I added 1 g of broccoli microgreen seeds, then covered with a thin layer of soil. Each morning, I would water each pot with a specific quantity of water. Pot 1 received 2 oz water, Pot 2 received 1.5 oz water, Pot 3 received 1 oz water, and Pot 4 received 0.5 oz water. Pot 5 was a control pot and received no water over the duration of the experiment to determine if the ambient moisture conditions in the GreenHab were sufficient to stimulate growth without watering. The soil moisture monitoring system consisted of four capacitive soil moisture sensors (one for each pot) attached to an Arduino Uno R3 microcomputer (Fig. 3). Two measurements were taken in the morning, one prior to watering and one after, and one measurement was taken in the evening via direct connection to a personal laptop while running an Arduino serial monitor code. An initial baseline reading for each was obtained a day after the soil was primed

(prior to seeding). I waited a day after priming to equilibrate the moisture content for each pot. Subsequent measurements were subtracted from these base values for the respective pots.
AD_4nXf1Ke4qlYlkSJfFNiIFrFjE0fxf_yfumwJKdFpZT6a3vDotUh97jPW6aeoSPI6XKvALSQj5YHTK2iDAscHRrHNrlluFHQkyy7JKX_ZqKrRCB4toHFKy0pihkwNm4zmofmlngJRNNA?key=UDBElswbanx1w2tkCIONab5X

Figure 3: The soil moisture monitoring setup. The Arduino Uno is shown in the bottom left of the image, and soil moisture sensors are shown in each pot, labelled 1-4. The image is from the final afternoon of the experiment, December 20. One can see how similar the microgreen growth is in Pots 1-3 despite receiving significantly different water quantities. .

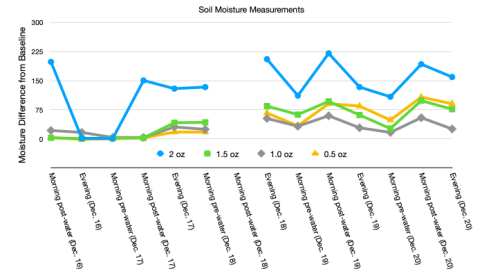
Results from the experiment are shown in Fig. 4. The first day of watering occurred on December 16. Initially, each pot was near the baseline value after the first watering except Pot 1 (2 oz). The 2 oz of water may have been sufficient to saturate more of the soil compared to the other pots. However, by the evening the pots had once again equilibrated. On the morning of Day 2, a sinusoidal pattern developed that persisted for the duration of the experiment, but the moisture of each pot seemed to reach a stable pattern on Day 3 (December 18). Pot 1 (2 oz) displayed the most significant change in soil moisture between morning watering and evening, and it maintained consistently higher soil moisture content than Pots 2-4. Interestingly, the pots ranging from 0.5 to 1.5 oz tend to have somewhat similar soil moisture content, each significantly lower than Pot 1 (2 oz). Pot 4 (0.5 oz) often has a higher soil moisture content than Pots 2 and 3, which is unexpected and may be due to a higher concentration of water being deposited near the sensor when watering, or a slightly different sensor depth. In general, the pots lose moisture at a relatively constant rate during the day and evening. Based on the sensor data alone, it seems that 0.5-1.5 oz of water could achieve similar soil moisture. However, most of the moisture could have remained in the top few cm of soil for Pots 2-4. This is in contrast with Pot 1 (2 oz) where water seemed to consistently saturate more of the soil and to a higher degree. This is an important result because microgreens have shallow roots and can be sustained by soil

moisture content at the surface rather than at depth. Therefore, I conclude that 2 oz of watering for these pots is more than needed to grow the microgreens.
AD_4nXcwJIjvV4RgC7RSGhoRgJ7L8tDUeWW1w6dB6p9bsps4onYNl-nm11nbDAdlUcvugV-WAG24YIb-2ch510wDhyAAB2s8rwfKxDyfPZDOZq2oXLNb9Xg_89BkYMEqXZNN_nKi72h1NA?key=UDBElswbanx1w2tkCIONab5X

Figure 4: Sensor data from the soil moisture monitoring station. The y-axis shows soil moisture values, and the x-axis shows the time of day when measurements were taken. Each colored line represents one of the pots: blue is Pot 1 (2 oz), Pot 2 is green (1.5 oz), grey is Pot 3 (1 oz), and Pot 4 (0.5 oz) is orange. There is a gap because data was not obtained for the Dec. 18 post water measurement.

This assertion is supported by observational evidence of microgreen growth (Fig. 3). The microgreens were first observed to sprout on the evening of December 19. Pot 1 (2 oz) clearly had 4 to 5 times the growth observed in Pot 2 (1.5 oz) and Pot 3 (1 oz). By the morning of December 20, Pots 1-3 clearly had microgreens occupying most of the pot; Pots 2 and 3 had similar amounts of microgreens, and about ¾ that of Pot 1. Pot 4 showed signs of soil disturbance caused by sprouting but the microgreens had not penetrated the surface of the soil. Based on the observed growth rates and soil moisture content, I conclude that 1 oz of water per pot is the most efficient watering practice for the broccoli microgreens. Pot 3 (1 oz) achieved a similar growth rate as Pot 2 (1.5 oz), and though it did not sprout as quickly as Pot 1 (2 oz), a similar level of growth was achieved by the end of the experiment with half the amount of water. A future experiment could be to first saturate each pot with variable amounts of water, then add a similar amount of water to each to see if a larger initial watering could stimulate growth and enable less subsequent watering.

To translate these results to the GreenHab, we can compare the pots to the raised beds that can be used for microgreen growth. The beds are 33.5”x 13” for a total surface area of 435.5 in2 and the pots are 3”x 3” for a surface area of 9 in2. Assuming the same depth, this means ~50 pots would fit in the raised bed, and that to efficiently water the bed it would take 50 oz per day. Throughout my time at MDRS, I have been using at least ~64 oz of water per day for one of these beds and sometimes an additional 30 oz. At minimum, my experiment supports that I could improve efficiency in raised bed watering by ~22%, a significant improvement. I would recommend 50 oz per day for future crews growing microgreens in raised beds. There may be changes in evaporative rates between the beds and pots which should either be calculated or tested.

3.

Title: Sampling Paleosol Sequences for Mars Comparison

Author(s): Hunter Vannier

Description, activities, and results: The goal of this project was to collect samples from at least one exposed paleosol sequence with the intention of bringing it back to Purdue University for spectral and microscopic analyses. Paleosols have been proposed to have been observed on Mars via rover data, and little work has been done to understand their role in sedimentary recycling and retention of past water on the Mars surface. Three paleosol sequences were collected (15 total samples) that represent tens of millions of years of history in the MDRS region. The first two sets were collected on Sol 3 in the interior and just outside Candor Chasma (Fig. 5). The third was collected near Zubrin’s head. Complimentary to the Crew Geologist’s work, river channel sediments were also collected at different locations across MDRS (7 total) with the aim of understanding how paleosols are recycled in the fluvial systems at MDRS, and how composition changes spatially across the field areas.
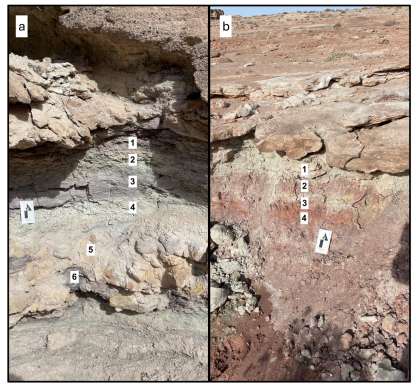
AD_4nXeAeUquebG3dEygFsGhkd0tICd051yM2BV447GqQU7mPbEm-ZNp_mKJxuV1E9uKXS1i_AGtev3z4RAjqg_Hjt27VRnlbct2ws4yF_zLJaoBEl9lIcvzNclBcooVkdUXEDfCZLaQpQ?key=UDBElswbanx1w2tkCIONab5XFigure 5: Example paleosol exposures observed during EVA 03 in Candor Chasma. Numbers indicate sampling locations within the paleosol sequence. (a) Paleosol sequence ~300 m after the entrance to Candor Chasma. Darker-toned layers indicate higher concentrations of organic material and are consistent with changing water environment. Capping rock is a

conglomerate and sandstone of the Morrison Formation (b) Paleosol sequence just exterior to the Candor Chasma entrance. Note the significant amount of red color compared to (a), indicating a much higher concentration of iron oxides. Cap rock is a fine-grained sandstone that is commonly exposed at ground level through the Compass Rock area.

The samples collected at MDRS will be analyzed in the pursuit of improving our understanding of paleosols on Mars and their relationship to variable climates on Mars. Visible to near infrared spectra, X-Ray fluorescence, and X-Ray diffraction data will be collected to form a preliminary data set to improve context for Mars observations. This data will likely be published at a conference in the next year. This data will also be the basis for a future NASA Solar Systems Working proposal to investigate the MDRS paleosols and river systems in greater detail.

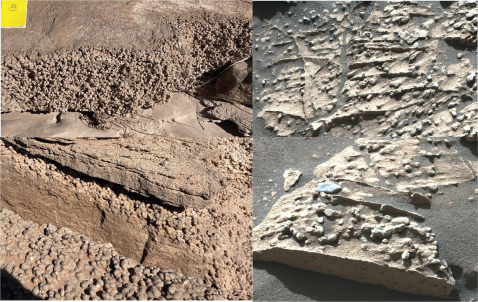
BONUS: we came across sedimentary concretions that are documented in the MDRS Geology Unofficial Handbook. These are very similar to outcrops recently observed in Jezero Crater by the Mars 2020 Rover. See Figure 6 for a comparison.

a

c
AD_4nXdp1e1R7jM9_b6Q1HrLJNAJTC2XYWe5CLhhOHeaaQ48N-EFtjkyGt8TBwKEtNLzr10TvZa0DLqGbLV0wSBdiTxyZxNxSpylb0BWq0qU09FzSFAQwfM3UjB19s5bjUQoZt1nTH81?key=UDBElswbanx1w2tkCIONab5Xb d

Figure 6: Comparison between concretions at MDRS and on Mars. (a,b) Sandstone concretions in the fluvial channel near Zubrin’s Head. (b,c) Concretions observed by the Mars 2020 Perseverance Rover in Jezero Crater near the Bright Angel formation around Sol 1022 (Courtesy Adrian Broz; publicly available images from Mastcam-Z).

4.

Title: Investigating Rover Applications in a Mars Analog Environment

Author(s): Spruha Vashi

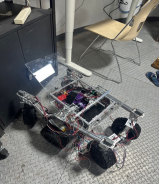
Description, activities, and results: The objective of this work was to build a modular rover that can traverse the analog Mars terrain along with crew members on EVA. Testing at MDRS was set to include mobility testing over different sections of terrain, confirming communications and operability, and exploring human-machine teaming capabilities. However, after multiple long days of group efforts at assembly and troubleshooting, the rover, named Hermes, was unfortunately unable to start and be ready for data collection, but is pictured in Figure 7. While this outcome was unfortunate and meant that Hermes could not be tested outside on EVAs, it provided a good insight into major improvements in assembly that can be applied for future testing. Understanding the complex system and its weakest points of failure was not lost, and this information now allows us to ensure a smoother assembly process in future usage.
AD_4nXfZUg-Wh08ej3o2GNaNJaESKQwg7K1XHwmaJ3a_9z2ZN1Sm5hRAPZc3ebpzT6UXGcx0fMb1spMdl3bnvxPlw65K6VnZUrsGkitSJfkinYds35SMiVcugpCXqE5aadoyzYH7NhU_uQ?key=UDBElswbanx1w2tkCIONab5X

Figure 7: Hermes the rover, with electronics and wiring included. Expected weight is 25 pounds, and expected maximum speed is 1.6 meters per second.

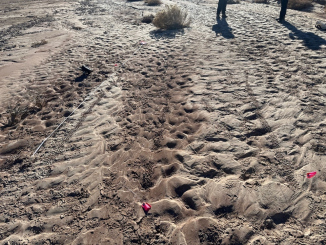
Although Hermes was not utilized on EVA, data and observations were still collected to help understand applications of rovers in the analog environment, especially in scenarios where the rover would act as a member of the EVA team. Some main points of investigation were mobility, functionality, communications, teaming strategies, and future design. For mobility, a single tire was taken out on EVA and tested on multiple different terrain types to understand its ability to travel across different terrain. Since the Crew Geologist’s research was primarily working with stream beds, most terrain testing was conducted on or near stream beds to understand the scenario in which the rover would be travelling along with the team while collecting stream bed data. The testing was done by rolling the single tire across 10ft strips of terrain multiple times, with the same downward pressure applied while rolling to simulate the actual rover’s 25lb weight, as seen in Figure 8. The results showed no more than 5 mm of tread depth in the softest terrain tested, compared to 200 mm footprints. In stream beds, the tires showed a clear tread but when hitting denser patches required more effort to get past. On dry and rocky lands, the tires showed no tread but rolled smoothly over different sizes of small rocks. It is still uncertain and unlikely that the rover would be able to traverse across very rocky, winding paths.
AD_4nXdiqt8N82wkuiZlumOLqViU2UjtUz3ZA8C2OQnPYiLNsfeK8ZPa8gq5wexFqS5HEgsy3ac2-5wnp8n-u68u6ewcL17Tt5IJ9Auuejtvk-NYgu7QbW8BvW5i1M3IW_3GWuiSjr2Ehg?key=UDBElswbanx1w2tkCIONab5X

Fig. 8: Image of terrain testing in a stream bed. Three strips of 10ft were identified and marked with flags and the tire was rolled along all three. Tire tracks are seen at each line, note that the found was denser in the center line and thus there are gaps of tracking since the tire slipped at those points.

To understand the functionality and teaming strategies that the rover could possibly adopt once it is functional, qualitative observations were made on certain aspects of data collection that delay operations and could be eliminated with the presence of a rover. For example, it was observed during the Crew Geologist’s stream bed measurements that the travel bag of materials is a hindrance to carry. It was noticed that writing down geological information, data points, and GPS information all takes time, and some of these items can be noted down by an autonomous system that is present, in this case, a rover. On EVA 11, the Crew Geologist was timed while he was taking measurements to understand his efficiency and points of improvement. On average, there was a reduction of about 1 minute of time from the Crew Geologist taking the measurement entirely by himself vs. having an EVA team member help with the measurement. While this confirms the idea that an EVA team will make data collection more efficient, the important note is that regardless of the number of members involved, data recording took 30-45 seconds for every measurement. Data recording was assumed to include notes on geological information, data points, and GPS information. All these items can be autonomized with a rover on hand that can collect and store the data and simplify the measurement process for the crew members. Another point of investigation was the time it takes for the rover to travel alongside a crew member. The specifications of Hermes indicate that its maximum speed would be about 1.6 meters per second, or approximately 3.5 miles per hour. Although Hermes was not actively tested, a measurement was made of comparing a crew member traveling from one data collection point to another at normal walking speed vs a crew member walking at specifically 3.5 mph (estimated to be 2 strides per second). The delay of a travelling rover was found to be 31 seconds and would also be further delayed in the case that the stream bed is very rocky, meaning it must travel on the outside, flatter areas.

The observations made on EVAs clarify future design upgrades of the rover. For example, communications and data recording capabilities, as well as carrying capacities would be the most ideal additions to Hermes at the time. It is hoped that with future usage of Hermes, more scientific applications can be implemented, and the rover can be well versed to work with many different variations of data collection and support the

crew’s research ambitions. Future observations of Hermes in action working in a team of scientists can further identify failure and improvement points for teaming strategies of autonomous systems and astronauts in analog environments, the Moon, Mars, and beyond.

5.

Title: MDRS Monitoring Overlay Sensors

Author(s): Monish Lokhande

Description, activities, and results:

Description: The project was focused on developing a network of Raspberry Pis To measure data from various locations in the habitat to measure the necessary sensor data (CO2, VOC, Air Quality, Temperature and Humidity). This data would be collected and analysed for any possible sudden changes. The “Sensor Packs” would be made to operate independently on batteries.

Activities: A total of two sensor packs were developed inhouse were placed in GreenHab and Lower Hab to continuously monitor the temperature, humidity and CO2 levels. The sensor packs relay the information in the two different types of feeds: Local and Global. The local feed updates every minute to provide real-time data to the crew members in the habitat and can be used by the local crew members to monitor the health of a certain location in the HAB. On the other hand, global feed is used as a transfer of necessary information to a remote ground station. The feed is designed in such a way that it considers the delays inherent in Mars-to Earth communication. To limit the consumption of bandwidth and latency effects, the global feed by default parses the data and sends only the necessary data at regular intervals when everything seems within acceptable range of values. The continuous relay of data for global feed is done when there is a sensor which is not functioning or has faulty values. The sensor modules have the dual functionality to power using battery packs or by a wall power source. This makes it possible to be located at any location in the habitat.

Limitations: The sensor modules had a limitation on the number of sensors because of limitation of data to be published. The CO2 sensors needed calibration to have a reference for correct value calculation and therefore the values had a higher fluctuation.

Results: The sensor modules developed actively monitor data from the GreenHab and Lower Hab successfully. The local dashboard image is given as a reference, which populates with data every minute. If

any sensor has faulty data, there is a corresponding notification sent to the local and global dashboards. Having local and global dashboards help crew members quickly analyse any faults as well as inform the remote ground station of any anomalies that might have occurred. Future applications will include adding a notification in the form of sound or LEDs, to alert which sensors are not working or giving not acceptable values. Another extension will be to include more sensors. The project is being continued by Crew 306 for their research.

AD_4nXedpaHfPgBDDMJXgP3dinZtQybZiPz7w7Sl2N2Yd1t96ZiuFHGbOU6NlQ7gB3CP4gaoshlHbo-ZztFeZx9vTr11HEo0OOprP-A4pKEaTPj1RGcdkBuJqYUJ6XtX9iBvAiq8-0yQvA?key=UDBElswbanx1w2tkCIONab5X

Figure 9a. Local Data Feeds for individual sensors

AD_4nXf1Tp781UQpRTQI7Oio10Cr_DZHH2X_dqyxwxDIXej4I0vrtxwEgpaxFHOjrbr3PFnAuHIbgxRaFiyGriKuoK0OBb2AGu01X-ccrl8GAjhslush30pk2PjeOQkOcGSQviozAugs3w?key=UDBElswbanx1w2tkCIONab5XFigure 9b. Local Dashboard for sensor information

6.

Title: Safety Lessons and Design Requirements on Autonomy for future Martian Habitats Author(s): Rashi Jain

Description, activities, and results:

Description: Mars will have both periods of dormancy and crewed operations. Therefore, future Martian habitats must integrate autonomous systems and design practices that ensure reliable and safe operations in both operational phases of the Hab. The objective of my study is to understand how the different systems work together in a Habitat, identify weak design points and practices, and recommend safety controls and design requirements for future autonomous systems that can ensure both quick decision-making and resilient and safe habitat operations.

Activity: For this, I am studying MDRS habitat design and operations during the 12 Sols that we have at the Mars Desert Research Station from December 8th, 2024 – December 20th, 2024 to: (i) identify and draw out the functional relations between different systems in the Habitat, (ii) analyze how effective are the Habitat systems at maintaining or providing resilience to the anomalies and faults that we face during the mission.

Results: In this report, I include the results from Sol 1 – Sol 6 operations. I am still working on processing the data from the remaining six sols. For Hab, I include results only from Science Dome and the EVA operations. I am still working on processing observations made in the Main Dome, Green Hab, Repair and Maintenance Module, the Tunnels, and the Airlock.

Habitat Design

I toured each section of the Habitat and documented the different design features and resources available in each of those sections. The purpose for this exercise in each Habitat section is to understand the different resources available in each dome and what they enable us to do. It helps us (i) analyze how can or can the equipment and resources available to us both locally in each dome, and throughout the Habitat help us navigate anomalous situations, and (ii) are the current design and resources adequate to interface with autonomous systems? What, if any, should be the design requirements for future robotics or autonomous systems?

This step led to Habitat Systems Functional Relations

Habitat Systems Functional Relations

Relations between different habitat systems at MDRS. The different systems in the Habitat can be categorized into the following seven: power; interior environment; environmental control, life support system, and extra-vehicular activity, food processing, structure, command, control, and communication; and human, robots/safety controls. Here we show only power, but during the time at MDRS these models have also been sketched out for extra-vehicular activity, interior-environment, and command, control, and communication. I am still working on putting together models for other systems listed.

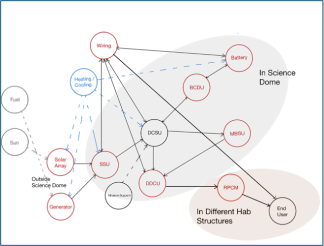
Power System: Figure 10 shows the power system component architecture and relations at the MDRS facility. There are two main sources of power, the solar panels (primary source) that are supposed to generate power and charge the batteries during daylight, and the backup generator (secondary source) that is to provide electricity in case solar panels malfunction, or the batteries run out of charge. Power generated through solar arrays, or the generator goes through a Sequential Shunt Unit integrated within the system which regulates the voltage of generated power. It then goes through a Direct Current Switching Unit (DCSU) which is the first component in the power distribution system. The DCSU determines power flow: i.e. how the power is distributed based on power generated and the integrated algorithm. DCSU interfaces with the batteries using a Battery Charge Discharge Unit (BCDU), whereas it interacts with the downstream loads using Main Bus Switching Unit (MBSU), DC to DC converter unit, that converts voltage to 120 Vdc, and Remote Power Controller Module (tripper box).
AD_4nXe6NcjbCFh-jQtU5ut1XGli-37DxCd2abUxbv-Kd_pcQI25Nl1sZDFGzlM8bZfSD1KJp9IjrQ1EHe3ih9KQyUwbLzN6iaikXWQozDIkxYaP4IqfQRhs-j758IzxUfnTccyISLG5xw?key=UDBElswbanx1w2tkCIONab5X

Figure 10: Power System Component Architecture and Relations at MDRS

With this power system component architecture and relation diagram at MDRS, we built a functionality diagram for individual components. Functionality diagrams are causal relation diagrams that show what the function of each component in the system is and what are the different factors it’s affected by. Figure 11 shows the functionality diagram of the solar panels. The grey circle represents the component itself (solar panel), the blue circle represents the function (generate power), the black circles represent the other systems in the Habitat system that affect either the component or its function (in this case we see that solar panel functions are affected by heating/cooling systems), the yellow circles represent variables and any other factors that influence the component’s function (in this case the solar irradiance affecting the power generative capacity).
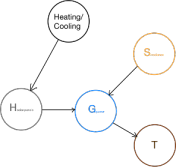
AD_4nXdv7fPYmsMD2dHVxrJmGwYBB1-BcQU5pUGecNyzycSUIory2JpAUqNn8xUIff0Xu7qQ5apxYBd7L5sFex72KVln7gEw1ddfQp_uGb1c23kS2ipL2ubM2FJNfoQjg8FCDzdBw6ux3A?key=UDBElswbanx1w2tkCIONab5X

Figure 11: Functionality diagram for Solar Panels

Using these functionality diagrams, we place “T” variables, also known as test variables. These T variables inform the design of where future monitoring systems should be placed. For instance, in case of a solar power, we recommend placing the

Operations summary: I monitored Hab operations, resources usage, and supplies through the 12 Sols and organized the data collected in an Excel sheet.

I use insights from Habitat Design, Systems Functional Relations, and Operations to establish Safety Lessons, and Design Requirements on Autonomy for Future Martian Habitats:

Safety Lessons:

1. Generate in-situ resources: With limited availability of resources available within the Habitat on Mars, we will need to generate in-situ resources. This includes water, oxygen, and fuel reserves. While Crew 305, did not conduct any experiment on in-situ resources: this should be a requirement for future crews as all long-duration mission to Mars will require the crew to become self

sustainable.

2. Make the most of available sources: Mars receives less than half the solar irradiance (590 W/m2) we receive on Earth, therefore every W of power generated here on Earth will have to be adjusted to what will be generated on Mars. It will be important to make the most of the resources available. For solar power, one can add solar concentrators and a controller that rotates the solar panels with solar position, like what happens at ISS.

3. Have a reliable source of reading for the sensors and water tank level: Our crew had two sources of water readings: one from the sensors at Hab, and the other that we got from our calculations. For the six sols I accounted for, the numbers differed anywhere 3.22 gallons – 37.855 gallons. We went with the more conservative estimate to estimate the remaining amount of water available to us. Given the scarcity of resources however, it is advisable to know exactly the amount of resource you have, and a margin of safety to it, than either under-estimate or overestimate.

4. Take an active effort at bringing the systems back to nominal operating conditions as soon as possible. Crew 305 Valles entered the Sim with no solar panel batteries non-functional (the Battery Charge Discharge Unit was broken, as a result of which, the batteries could not store power). This resulted in the crew using solar power in the day as the main source of energy during the day and the backup generator as the main source of energy during the night. In case one or the other failed, the crew would be left without power, which is essential to keep all critical systems running on Martian habitats.

5. Have magnetic self-aligned helmets on EVA suits. While we were a crew of six, with three people going on EVA and three people staying back to help with EVA operations, initial missions on Mars can have a lot of unexpected situations. For e.g. need for a rescue mission, only one person in the EVA/airlock module. It is important that while each crew member has help, they are also independent and able to wear their own space suit with minimal help from the others. One big problem with the two piece suits is the alignment of the helmet

6. Have multiple ports of exit: Cabin depressurization is a big cause of concern on extra-terrestrial habitats, both on Mars and especially on the Moon. In case of cabin depressurization, sections of the Hab will be isolated using airlocks. When this happens it is still imperative that people in other sections of the Habitat are able to safely exit the Hab. While it is not possible to have all EVA equipment in all Hab modules, it is important to limit the number of people in domes at one time and have the adequate number of EVA equipment and an exit airlock in each module.

7. Check for consistency in equipment performance: For the first six EVAs, I calculated the drop in percentage per mile travelled by the rovers (see Table 1). We see that the rovers perform better at preserving battery for longer distances than they do for shorter EVAs.

Table 2: Drop in Percentage per Mile of Rovers for the First Six EVAs.

Drop in percentage per mile travelled.

Miles

Curiosity

Perseverance

Opportunity

Spirit

EVA 1

0.55

20

10.90909091

EVA 2

0.55

10.90909091

9.09090909

EVA 3

3

8

3.33333333

EVA 4

7.45

4.02684564

4.966442953

EVA 5

5.54

6.137184116

5.77617329

EVA 6

8.22

4.501216545

4.62287105

We can use this information to keep track of rover performance, and confidently estimate how much each individual rover can travel before it runs out of charge. Long term tracking of rover’s performance will also help astronauts determine whether a rover needs earlier maintenance or not.

8. Install methods for investigating software bugs: Crew 305 Valles used Astrolink to track the GPS coordinates of the crew while they are out on EVA. One of the EVAs, the Astrolink software, showed four trackers out instead of three. The Hab comms team communicated with the EVA crew if they had an extra-tracker (Astrolink 10) on them. Upon receiving a negative, the crew with the Mission Support established that Astrolink 10 was a digital artifact. Situations like these, however, are getting increasingly confusing with a larger / independent crew. It is important to have methods for investigating software bugs (evaluating what the root cause is) like these and addressing them.

9. Practice concise comms: Currently, aviation pilots use very precise language to communicate with other pilots and the Air Traffic Controller. It is important to establish similar rules for communication

over comms such that everyone is heard clearly without any misinterpretation. Crew 305 progressively improved in their communication while in the Sim.

10. Understand your systems well: It took a while for Crew 305 to realize that the rovers read the total number of hours they have been operational rather than remaining range on the full charge. While the crew was able to accurately figure out in time what the rover reading said (and fortunately it did not lead to any accidents), it is important for the crew to understand the systems they are working with well – to avoid any mis-interpretations that could lead to mishandling data or equipment.

Design Requirements on Autonomy for future Martian Habitats:

1. Add following monitoring systems and add remote access to them in each Hab area. a. Battery charges

b. Power Generated by Solar Panels

c. Temperature Sensors for Generators and Fuel Cells

d. Voltmeters for Sequential Shunt Units

Our functionality models for the power systems revealed that it is important to have the following sensors to track performance of the power systems at any given time. The readings can be output to the Main Dome Computer Unit that tracks all other systems. This is important for both equipment performance tracking and smooth autonomous system integration.

2. Have a running inventory of the Hab and the different resources available.

3. Automate system transitions: 1) and 2) will allow smooth automated system transitions. While the MDRS has very active Mission Support to facilitate these transitions, Mars is not going to have Mission Support. Or the Mission Support will be 20 – 40 minute lag, and won’t be able to provide on-site services.

4. Have functional backup devices that are structurally non-redundant: During the power outage, the Main Dome in Crew 305 relied on an igniter heater that did not rely on the electricity, but instead on propane. This kept the crew warm, even when the electric heating system didn’t work. This highlights that it is important to have back up devices that are functionally redundant, but not structurally redundant.

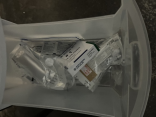
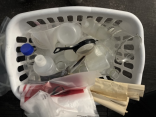
5. Organize resources and tools for ease of use: Figure 12 shows some of the cabinet space organization in the Science Dome that house different equipment.
AD_4nXfod5Od-HWnKGYduDRDqmj7dIblrl6IGcBFKCcSVbzDtz8tHz9kJTt2A0vo1t8Dy8_gtlfGKIAHogJchfqIq4snxyFyxJTHyAtnVFVlrgShOpR_AESZRjFA31frF36kL-AEdqx6nw?key=UDBElswbanx1w2tkCIONab5XAD_4nXcCjm_bWvVuNKE3ohqHkJd9MM02TL9ZnlODSdX3n0jwV4QYrGv1pizrtgYBTICiDXxHKjFhxpESKKPWkjniwZyQpjNB4bxR0jpB_dAX74tSA6HMArKfLIwuINEdqDHxnWbEcV9Lwg?key=UDBElswbanx1w2tkCIONab5XAD_4nXe07c-CtAqMa4ZX5NY1ZWNJRk8KAwJ3LMaRVO8n3yHmAuzqrhH9gn5Z318W0AKj2G9rSmInbS1mgrl8MginXofU5X6KSqX_EQC92va9cHWvdrysWcZcpCD-9TZyK84bs7mAxYyy?key=UDBElswbanx1w2tkCIONab5X

Figure 12: Cabinet Organization in Science Dome

While this setup is good for a human to work with. They will look around and find out what they need, it is too cumbersome for an autonomous system and will confuse them. Autonomous systems will need a cleaner organization to work efficiently. The best way to currently do this is to use a 3D printer, where you can create custom shelves and cabinets that autonomous systems can easily work around with.

Future work on this will include compiling a list of functionality models for all systems and components I documented at MDRS. These component functionality models will be used to create a digital extraterrestrial habitat model on the Control-Oriented Dynamic Computational Modeling Platform, where we can simulate different disruptions that will be present on Mars that cannot be simulated at MDRS either due to their absence (such as radiation) or for safety reasons.

7.

Title: Wearable-Based Autonomic Activity Profiles for Real-Time Cognitive Performance Monitoring in Spaceflight

Author(s): Peter Zoss

Description, activities, and results: This study will longitudinally quantify individual changes in autonomic nervous system (ANS) status via a wearable sensor in MDRS crew members to understand how our autonomic activity is associated with sequential measures of cognitive performance for predictive model development. Baseline data from the wearable devices will also be used to look at changes while living in analog isolation. The activities planned to be completed at MDRS included cognitive performance testing. This testing was scheduled to take place every other day starting from Sol 1 for a total of 6 testing sessions for each of the crew members.

This human factor project was able to get through all of its data collection period at MDRS. Cognitive performance testing has been completed for all crew members for the planned 6 tests at the MDRS. These tests occurred on Sols 1, 3, 5, 7, 9 and 11. The tests on Sol 3 had to end early due to power failure, resulting in an incomplete test for one crew member and a missed test for another. The cognitive performance test used is called the Cognition Test Battery, and it was administered to the crew via an iPad. The results from this research will be looked at further back in West Lafayette where analysis can be completed.

Crew 305 Mission Summary_final.docx

Research Report – December 20th

[category science-report]

Mars Desert Research Station

Final Research Report

Crew 305 – Valles

Dec 8th, 2024 – Dec 21st, 2024

Crew Members:

Commander and GreenHab Officer: Hunter Vannier

Executive Officer and Crew Geologist: Ian Pamerleau

Crew Engineer: Spruha Vashi

Health and Safety Officer: Peter Zoss

Crew Journalist: Rashi Jain

Crew Scientist: Monish Lokhande

AD_4nXfG08Wytn6yH1DAL_Nu6GbkNFNTh3gnNWrsC5MQzXHLIf5Y4C4FgjQwLBV0nbusy-I9I-8DdOOZIyo9mK1Tr74ZhkddLuI5Py-M3xEoLvsJh622vbwDh9theB0hGu1V2xMT9NF3sQ?key=nXF6LhGPgVKlB_50n6BnRzoV

Research Projects:

1.

Title: Hydraulic Geometry of Ephemeral Streams to Potentially Elucidate Paleoclimate Author: Ian Pamerleau

Description, activities, and results: Ephemeral streams are present around the MDRS campus and carve out the landscape after heavy rain. The hydraulic geometry of these streams mathematically describes how the width and drainage area change as the flow moves up- to downstream. There is a range of values that the hydraulic geometry of rivers tends to fall within, which tells us more about climate, lithology, and sediment load. These values have been established for the more “mature” rivers with constantly flowing water.

However, the ephemeral streams at MDRS may not have achieved the values present in the literature. I will test if the ephemeral streams of MDRS hold the same hydraulic geometry in the literature, and if it is able to tell us anything about the climate.

We were able to thoroughly explore the three major areas where I wanted to take stream width measurements: Candor Chasma, Eos Chasma, and the region southeast of Kissing Camel Ridge (KCR). My objective was to take measurements of branching tributaries and between said tributaries along a main channel because the drainage area of a channel will substantially increase when the area of another stream is added. We also took three measurements of the stream width at each location a meter or so apart from one another to get an average width of the location.

I have not been able to create a plot of my data yet and am still in the processing stage. The trend I expect to see (i.e., smaller drainage area locations yield smaller stream widths and larger drainage area locations yield larger stream widths) will likely hold based on my observations and preliminary processing. The data may become a bit more complicated when comparing two sections of high drainage area, however, as there seemed to have been some variability in different factors such as lithology, slope, vegetation, etc.. I tried to limit these factors based on the location I chose but it is impossible to fully eliminate them, but I have taken photos of each location we took measurements of to better analyze any anomalies. I will hopefully be able to discuss these results with my undergraduate research advisor (whom I have worked on a geomorphology project with) or a geomorphologist/hydrologist at Purdue and share my findings at a conference once the analysis has been completed.

2.

Title: Effect of Variable Soil Moisture on Microgreen Growth

Author(s): Hunter Vannier

Description, activities, and results: Efficient plant growth is an important element of life at MDRS and will be critical for sustainability if we want to create a self-sustaining presence on other planetary bodies. For this project, I aimed to conduct an experiment that investigated how soil moisture content affects microgreen growth to find efficient watering practices. The established GreenHab infrastructure at the Mars Desert Research Station is an ideal place to conduct this experiment.

Experimental setup: I filled four 3” x 3” potting containers with Miracle Grow potting soil available in the GreenHab. The soil required priming and mixing with water, so the pots started out with some moisture level. In each of the pots, I added 1 g of broccoli microgreen seeds, then covered with a thin layer of soil. Each morning, I would water each pot with a specific quantity of water. Pot 1 received 2 oz water, Pot 2 received 1.5 oz water, Pot 3 received 1 oz water, and Pot 4 received 0.5 oz water. Pot 5 was a control pot and received no water over the duration of the experiment to determine if the ambient moisture conditions in the GreenHab were sufficient to stimulate growth without watering. The soil moisture monitoring system consisted of four capacitive soil moisture sensors (one for each pot) attached to an Arduino Uno R3 microcomputer (Fig. 1). Two measurements were taken in the morning, one prior to watering and one after, and one measurement was taken in the evening via direct connection to a personal laptop while running an Arduino serial monitor code. An initial baseline reading for each was obtained a day after the soil was primed

(prior to seeding). I waited a day after priming to equilibrate the moisture content for each pot. Subsequent measurements were subtracted from these base values for the respective pots.

AD_4nXcQJt8LkDQLbPncVr0r7je9XdFQ8EI_zwbKk1A71t1s8Uj4ulq2Ik-MTBoy5f9Tor0y4JVbW_E8whmxJ_9iuGEDooNg_L2XALlQnVXR3zkiAV94W8UhzHt_eZsGlGY5L0bohI5KVw?key=nXF6LhGPgVKlB_50n6BnRzoV

Figure 1: The soil moisture monitoring setup. The Arduino Uno is shown in the bottom left of the image, and soil moisture sensors are shown in each pot, labelled 1-4. The image is from the final afternoon of the experiment, December 20. One can see how similar the microgreen growth is in Pots 1-3 despite receiving significantly different water quantities. .

Results from the experiment are shown in Fig. 2. The first day of watering occurred on December 16. Initially, each pot was near the baseline value after the first watering except Pot 1 (2 oz). The 2 oz of water may have been sufficient to saturate more of the soil compared to the other pots. However, by the evening the pots had once again equilibrated. On the morning of Day 2, a sinusoidal pattern developed that persisted for the duration of the experiment, but the moisture of each pot seemed to reach a stable pattern on Day 3 (December 18). Pot 1 (2 oz) displayed the most significant change in soil moisture between morning watering and evening, and it maintained consistently higher soil moisture content than Pots 2-4. Interestingly, the pots ranging from 0.5 to 1.5 oz tend to have somewhat similar soil moisture content, each significantly lower than Pot 1 (2 oz). Pot 4 (0.5 oz) often has a higher soil moisture content than Pots 2 and 3, which is unexpected and may be due to a higher concentration of water being deposited near the sensor when watering, or a slightly different sensor depth. In general, the pots lose moisture at a relatively constant rate during the day and evening. Based on the sensor data alone, it seems that 0.5-1.5 oz of water could achieve similar soil moisture. However, most of the moisture could have remained in the top few cm of soil for Pots 2-4. This is in contrast with Pot 1 (2 oz) where water seemed to consistently saturate more of the soil and to a higher degree. This is an important result because microgreens have shallow roots and can be sustained by soil

moisture content at the surface rather than at depth. Therefore, I conclude that 2 oz of watering for these pots is more than needed to grow the microgreens.

AD_4nXd0XXIAAqCTIs-2lyZpfhL4EkShB2FYA40ktovrAaZfvicdpacRfTiWzyAyRn5x-JwvwV8nFPXFMqPMw98XZqG-Vzmir50SDCya5xh5hL5tGmprVyB0-lzejB5O4uNowykXOft2hA?key=nXF6LhGPgVKlB_50n6BnRzoV

Figure 2: Sensor data from the soil moisture monitoring station. The y-axis shows soil moisture values, and the x-axis shows the time of day when measurements were taken. Each colored line represents one of the pots: blue is Pot 1 (2 oz), Pot 2 is green (1.5 oz), grey is Pot 3 (1 oz), and Pot 4 (0.5 oz) is orange. There is a gap because data was not obtained for the Dec. 18 post water measurement.

This assertion is supported by observational evidence of microgreen growth (Fig. 1). The microgreens were first observed to sprout on the evening of December 19. Pot 1 (2 oz) clearly had 4 to 5 times the growth observed in Pot 2 (1.5 oz) and Pot 3 (1 oz). By the morning of December 20, Pots 1-3 clearly had microgreens occupying most of the pot; Pots 2 and 3 had similar amounts of microgreens, and about ¾ that of Pot 1. Pot 4 showed signs of soil disturbance caused by sprouting but the microgreens had not penetrated the surface of the soil. Based on the observed growth rates and soil moisture content, I conclude that 1 oz of water per pot is the most efficient watering practice for the broccoli microgreens. Pot 3 (1 oz) achieved a similar growth rate as Pot 2 (1.5 oz), and though it did not sprout as quickly as Pot 1 (2 oz), a similar level of growth was achieved by the end of the experiment with half the amount of water. A future experiment could be to first saturate each pot with variable amounts of water, then add a similar amount of water to each to see if a larger initial watering could stimulate growth and enable less subsequent watering.

To translate these results to the GreenHab, we can compare the pots to the raised beds that can be used for microgreen growth. The beds are 33.5”x 13” for a total surface area of 435.5 in2 and the pots are 3”x 3” for a surface area of 9 in2. Assuming the same depth, this means ~50 pots would fit in the raised bed, and that to efficiently water the bed it would take 50 oz per day. Throughout my time at MDRS, I have been using at least ~64 oz of water per day for one of these beds and sometimes an additional 30 oz. At minimum, my experiment supports that I could improve efficiency in raised bed watering by ~22%, a significant improvement. I would recommend 50 oz per day for future crews growing microgreens in raised beds. There may be changes in evaporative rates between the beds and pots which should either be calculated or tested.

3.

Title: Sampling Paleosol Sequences for Mars Comparison

Author(s): Hunter Vannier

Description, activities, and results: The goal of this project was to collect samples from at least one exposed paleosol sequence with the intention of bringing it back to Purdue University for spectral and microscopic analyses. Paleosols have been proposed to have been observed on Mars via rover data, and little work has been done to understand their role in sedimentary recycling and retention of past water on the Mars surface. Three paleosol sequences were collected (15 total samples) that represent tens of millions of years of history in the MDRS region. The first two sets were collected on Sol 3 in the interior and just outside Candor Chasma (Fig. 3). The third was collected near Zubrin’s head. Complimentary to the Crew Geologist’s work, river channel sediments were also collected at different locations across MDRS (7 total) with the aim of understanding how paleosols are recycled in the fluvial systems at MDRS, and how composition changes spatially across the field areas.

AD_4nXd3LW-fxnFrETmaSI0xQvvl9cZGEn0OA_ZIfVx4sxWC92vENUgwtjT3OZV2fPsASIZUGJriEweYvjvTdFY3N6hMz0GLTJS2Bmk7LQnwcrQKv5zXBtzRTXpyy54d8tyyLVC4fljP?key=nXF6LhGPgVKlB_50n6BnRzoVFigure 3: Example paleosol exposures observed during EVA 03 in Candor Chasma. Numbers indicate sampling locations within the paleosol sequence. (a) Paleosol sequence ~300 m after the entrance to Candor Chasma. Darker-toned layers indicate higher concentrations of organic material and are consistent with changing water environment. Capping rock is a

conglomerate and sandstone of the Morrison Formation (b) Paleosol sequence just exterior to the Candor Chasma entrance. Note the significant amount of red color compared to (a), indicating a much higher concentration of iron oxides. Cap rock is a fine-grained sandstone that is commonly exposed at ground level through the Compass Rock area.

The samples collected at MDRS will be analyzed in the pursuit of improving our understanding of paleosols on Mars and their relationship to variable climates on Mars. Visible to near infrared spectra, X-Ray fluorescence, and X-Ray diffraction data will be collected to form a preliminary data set to improve context for Mars observations. This data will likely be published at a conference in the next year. This data will also be the basis for a future NASA Solar Systems Working proposal to investigate the MDRS paleosols and river systems in greater detail.

BONUS: we came across sedimentary concretions that are documented in the MDRS Geology Unofficial Handbook. These are very similar to outcrops recently observed in Jezero Crater by the Mars 2020 Rover. See Figure 4 for a comparison.

a

c

AD_4nXccdkVnQhjqWw8W5R6Z0rPNiLDgsu3CZZxoztiQHBEuRuN3HdkwuZDNBLJikSTGHOVVp0JTuHRDk627IK_fmoDE27CDIRtXc0KPWYnvMA7-2ahbBoNCYF7b73hDnmPBCDLepccEYg?key=nXF6LhGPgVKlB_50n6BnRzoVb d

Figure 4: Comparison between concretions at MDRS and on Mars. (a,b) Sandstone concretions in the fluvial channel near Zubrin’s Head. (b,c) Concretions observed by the Mars 2020 Perseverance Rover in Jezero Crater near the Bright Angel formation around Sol 1022 (Courtesy Adrian Broz; publicly available images from Mastcam-Z).

4.

Title: Investigating Rover Applications in a Mars Analog Environment

Author(s): Spruha Vashi

Description, activities, and results: The objective of this work was to build a modular rover that can traverse the analog Mars terrain along with crew members on EVA. Testing at MDRS was set to include mobility testing over different sections of terrain, confirming communications and operability, and exploring human-machine teaming capabilities. However, after multiple long days of group efforts at assembly and troubleshooting, the rover, named Hermes, was unfortunately unable to start and be ready for data collection, but is pictured in Figure 5. While this outcome was unfortunate and meant that Hermes could not be tested outside on EVAs, it provided a good insight into major improvements in assembly that can be applied for future testing. Understanding the complex system and its weakest points of failure was not lost, and this information now allows us to ensure a smoother assembly process in future usage.

AD_4nXc_XllXfeSrelpjhdRWXP41gL87kTSY8PTBH1Pq9-szevSSHvl4wS1KqgPSEDicJ_MHvAwCtYg__RdW2N1mD3k-98V0dJcVuK36B-u19ZDJWZZNS2BWo_PhDcqtUQE8QBkpLiLz?key=nXF6LhGPgVKlB_50n6BnRzoV

Figure 5: Hermes the rover, with electronics and wiring included. Expected weight is 25 pounds, and expected maximum speed is 1.6 meters per second.

Although Hermes was not utilized on EVA, data and observations were still collected to help understand applications of rovers in the analog environment, especially in scenarios where the rover would act as a member of the EVA team. Some main points of investigation were mobility, functionality, communications, teaming strategies, and future design. For mobility, a single tire was taken out on EVA and tested on multiple different terrain types to understand its ability to travel across different terrain. Since the Crew Geologist’s research was primarily working with stream beds, most terrain testing was conducted on or near stream beds to understand the scenario in which the rover would be travelling along with the team while collecting stream bed data. The testing was done by rolling the single tire across 10ft strips of terrain multiple times, with the same downward pressure applied while rolling to simulate the actual rover’s 25lb weight, as seen in Figure 6. The results showed no more than 5 mm of tread depth in the softest terrain tested, compared to 200 mm footprints. In stream beds, the tires showed a clear tread but when hitting denser patches required more effort to get past. On dry and rocky lands, the tires showed no tread but rolled smoothly over different sizes of small rocks. It is still uncertain and unlikely that the rover would be able to traverse across very rocky, winding paths.

AD_4nXe1_gosO2ou-WU3BZJkmWXUpobR1am7UzsA-_uGpflQH1yDwXdwDQsdcXuByb8LHwfU9XILDKxFYffWFDUaAi2xLI1twq-aIUihMkOFYSApeYNjEJoFLZzFUceLNhqOptv8aYPkEg?key=nXF6LhGPgVKlB_50n6BnRzoV

Fig. 6: Image of terrain testing in a stream bed. Three strips of 10ft were identified and marked with flags and the tire was rolled along all three. Tire tracks are seen at each line, note that the found was denser in the center line and thus there are gaps of tracking since the tire slipped at those points.

To understand the functionality and teaming strategies that the rover could possibly adopt once it is functional, qualitative observations were made on certain aspects of data collection that delay operations and could be eliminated with the presence of a rover. For example, it was observed during the Crew Geologist’s stream bed measurements that the travel bag of materials is a hindrance to carry. It was noticed that writing down geological information, data points, and GPS information all takes time, and some of these items can be noted down by an autonomous system that is present, in this case, a rover. On EVA 11, the Crew Geologist was timed while he was taking measurements to understand his efficiency and points of improvement. On average, there was a reduction of about 1 minute of time from the Crew Geologist taking the measurement entirely by himself vs. having an EVA team member help with the measurement. While this confirms the idea that an EVA team will make data collection more efficient, the important note is that regardless of the number of members involved, data recording took 30-45 seconds for every measurement. Data recording was assumed to include notes on geological information, data points, and GPS information. All these items can be autonomized with a rover on hand that can collect and store the data and simplify the measurement process for the crew members. Another point of investigation was the time it takes for the rover to travel alongside a crew member. The specifications of Hermes indicate that its maximum speed would be about 1.6 meters per second, or approximately 3.5 miles per hour. Although Hermes was not actively tested, a measurement was made of comparing a crew member traveling from one data collection point to another at normal walking speed vs a crew member walking at specifically 3.5 mph (estimated to be 2 strides per second). The delay of a travelling rover was found to be 31 seconds and would also be further delayed in the case that the stream bed is very rocky, meaning it must travel on the outside, flatter areas.

The observations made on EVAs clarify future design upgrades of the rover. For example, communications and data recording capabilities, as well as carrying capacities would be the most ideal additions to Hermes at the time. It is hoped that with future usage of Hermes, more scientific applications can be implemented, and the rover can be well versed to work with many different variations of data collection and support the

crew’s research ambitions. Future observations of Hermes in action working in a team of scientists can further identify failure and improvement points for teaming strategies of autonomous systems and astronauts in analog environments, the Moon, Mars, and beyond.

5.

Title: MDRS Monitoring Overlay Sensors

Author(s): Monish Lokhande

Description, activities, and results:

Description: The project was focused on developing a network of Raspberry Pisto measure data from various locations in the habitat to measure the necessary sensor data (CO2, VOC, Air Quality, Temperature and Humidity). This data would be collected and analysed for any possible sudden changes. The “Sensor Packs” would be made to operate independently on batteries.

Activities: A total of two sensor packs were developed inhouse were placed in GreenHab and Lower Hab to continuously monitor the temperature, humidity and CO2 levels. The sensor packs relay the information in the two different types of feeds: Local and Global. The local feed updates every minute to provide real-time data to the crew members in the habitat and can be used by the local crew members to monitor the health of a certain location in the hab. On the other hand, global feed is used as a transfer of necessary information to a remote ground station. The feed is designed in such a way that it considers the delays inherent in Mars-to Earth communication. To limit the consumption of bandwidth and latency effects, the global feed by default parses the data and sends only the necessary data at regular intervals when everything seems within acceptable range of values. The continuous relay of data for global feed is done when there is a sensors which is not functioning or has faulty values. The sensor modules have the dual functionality to power using battery packs or by a wall power source. This makes it possible to be located at any location in the habitat.

Limitations: The sensor modules had a limitation on the number of sensors because of limitation of data to be published. The CO2 sensors needed calibration to have a reference for correct value calculation and therefore the values had a higher fluctuation.

Results: The sensor modules developed actively monitor data from the GreenHab and Lower Hab successfully. The local dashboard image is given as a reference, which populates with data every minute. If

any sensor has faulty data, there is a corresponding notification sent to the local and global dashboards. Having local and global dashboards help crew members quickly analyse any faults as well as inform the remote ground station of any anomalies that might have occurred. Future applications will include adding a notification in the form of sound or LEDs, to alert which sensors are not working or giving not acceptable values. Another extension will be to include more sensors. The project is being continued by Crew 306 for their research.

AD_4nXeOEHfPm72LlVcfznJhD_L_rETQdoDCnNNSr8rUqp0UfDWOY2ADd5ULUegc4XB1LE6EAYM_Qg97xFB1lPD2B-xdm6vJMGnMIugL-XJRme2XTJueYsFa50vfmalljoggakHsCC2WGg?key=nXF6LhGPgVKlB_50n6BnRzoV

Figure 7a. Local Data Feeds for individual sensors

AD_4nXeVRyRJPZvvZAFwg1Kr7AaqgD4LKJckOX0AM8ubOXsaiy1Phc2qgPO2ok8tkQ0P-qHqNfwAj-xFLppioW-SFGFNTguj5fII2MurBLCljTpaKjNtyHLy_PVd8clQXb4jUghMwGpp?key=nXF6LhGPgVKlB_50n6BnRzoVFigure 7b. Local Dashboard for sensor information

6.

Title: Safety Lessons and Design Requirements on Autonomy for future Martian Habitats Author(s): Rashi Jain

Description, activities, and results:

Description: Mars will have both periods of dormancy and crewed operations. Therefore, future Martian habitats must integrate autonomous systems and design practices that ensure reliable and safe operations in both operational phases of the Hab. The objective of my study is to understand how the different systems work together in a Habitat, identify weak design points and practices, and recommend safety controls and design requirements for future autonomous systems that can ensure both quick decision-making and resilient and safe habitat operations.

Activity: For this, I am studying MDRS habitat design and operations during the 12 Sols that we have at the Mars Desert Research Station from December 8th, 2024 – December 20th, 2024 to: (i) identify and draw out the functional relations between different systems in the Habitat, (ii) analyze how effective are the Habitat systems at maintaining or providing resilience to the anomalies and faults that we face during the mission.

Results: In this report, I include the results from Sol 1 – Sol 6 operations. I am still working on processing the data from the remaining six sols. For Hab, I include results only from Science Dome and the EVA operations. I am still working on processing observations made in the Main Dome, Green Hab, Repair and Maintenance Module, the Tunnels, and the Airlock.

Habitat Design

I toured each section of the Habitat and documented the different design features and resources available in each of those sections. The purpose for this exercise in each Habitat section is to understand the different resources available in each dome and what they enable us to do. It helps us (i) analyze how can or can the equipment and resources available to us both locally in each dome, and throughout the Habitat help us navigate anomalous situations, and (ii) are the current design and resources adequate to interface with autonomous systems? What, if any, should be the design requirements for future robotics or autonomous systems?

This step led to Habitat Systems Functional Relations

Habitat Systems Functional Relations

Relations between different habitat systems at MDRS. The different systems in the Habitat can be categorized into the following seven: power; interior environment; environmental control, life support system, and extra-vehicular activity, food processing, structure, command, control, and communication; and human, robots/safety controls. Here we show only power, but during the time at MDRS these models have also been sketched out for extra-vehicular activity, interior-environment, and command, control, and communication. I am still working on putting together models for other systems listed.

Power System: Figure 8 shows the power system component architecture and relations at the MDRS facility. There are two main sources of power, the solar panels (primary source) that are supposed to generate power and charge the batteries during daylight, and the backup generator (secondary source) that is to provide electricity in case solar panels malfunction, or the batteries run out of charge. Power generated through solar arrays, or the generator goes through a Sequential Shunt Unit integrated within the system which regulates the voltage of generated power. It then goes through a Direct Current Switching Unit (DCSU) which is the first component in the power distribution system. The DCSU determines power flow: i.e. how the power is distributed based on power generated and the integrated algorithm. DCSU interfaces with the batteries using a Battery Charge Discharge Unit (BCDU), whereas it interacts with the downstream loads using Main Bus Switching Unit (MBSU), DC to DC converter unit, that converts voltage to 120 Vdc, and Remote Power Controller Module (tripper box).

AD_4nXeqUSWOanEIR1Rp7ZZRFp-v0JKrfw6MG7ruq2js4nY5hUB0dpl8rhJxO_CcL7DV1gwAPxxeAULW-BtSL4MF9_Bk0gdJJoAdreXhfqhTJZJfeRsXmYANHDJG2gJp7fLro-7KJdeYlw?key=nXF6LhGPgVKlB_50n6BnRzoV

Figure 8: Power System Component Architecture and Relations at MDRS

With this power system component architecture and relation diagram at MDRS, we built a functionality diagram for individual components. Functionality diagrams are causal relation diagrams that show what the function of each component in the system is and what are the different factors it’s affected by. Figure 9 shows the functionality diagram of the solar panels. The grey circle represents the component itself (solar panel), the blue circle represents the function (generate power), the black circles represent the other systems in the Habitat system that affect either the component or its function (in this case we see that solar panel functions are affected by heating/cooling systems), the yellow circles represent variables and any other factors that influence the component’s function (in this case the solar irradiance affecting the power generative capacity).

AD_4nXcva6TWaWV5LlIydM-zzO-BA15P6-diT4KKq7_iNlsoWpPs94TgqJbCXt_0cvYoopuTSY0a4TT7dq3fvwI7bhv1W0FlQMVxiUX0ccHqOOzGJD2brPCew7P8yxbh-ERc021J-lUNeQ?key=nXF6LhGPgVKlB_50n6BnRzoV

Figure 9: Functionality diagram for Solar Panels

Using these functionality diagrams, we place “T” variables, also known as test variables. These T variables inform the design of where future monitoring systems should be placed. For instance, in case of a solar power, we recommend placing the

Operations summary: I monitored Hab operations, resources usage, and supplies through the 12 Sols and organized the data collected in an Excel sheet.

I use insights from Habitat Design, Systems Functional Relations, and Operations to establish Safety Lessons, and Design Requirements on Autonomy for Future Martian Habitats:

Safety Lessons:

1. Generate in-situ resources: With limited availability of resources available within the Habitat on Mars, we will need to generate in-situ resources. This includes water, oxygen, and fuel reserves. While Crew 305, did not conduct any experiment on in-situ resources: this should be a requirement for future crews as all long-duration mission to Mars will require the crew to become self

sustainable.

2. Make the most of available sources: Mars receives less than half the solar irradiance (590 W/m2) we receive on Earth, therefore every W of power generated here on Earth will have to be adjusted to what will be generated on Mars. It will be important to make the most of the resources available. For solar power, one can add solar concentrators and a controller that rotates the solar panels with solar position, like what happens at ISS.

3. Have a reliable source of reading for the sensors and water tank level: Our crew had two sources of water readings: one from the sensors at Hab, and the other that we got from our calculations. For the six sols I accounted for, the numbers differed anywhere 3.22 gallons – 37.855 gallons. We went with the more conservative estimate to estimate the remaining amount of water available to us. Given the scarcity of resources however, it is advisable to know exactly the amount of resource you have, and a margin of safety to it, than either under-estimate or overestimate.

4. Take an active effort at bringing the systems back to nominal operating conditions as soon as possible. Crew 305 Valles entered the Sim with no solar panel batteries non-functional (the Battery Charge Discharge Unit was broken, as a result of which, the batteries could not store power). This resulted in the crew using solar power in the day as the main source of energy during the day and the backup generator as the main source of energy during the night. In case one or the other failed, the crew would be left without power, which is essential to keep all critical systems running on Martian habitats.

5. Have magnetic self-aligned helmets on EVA suits. While we were a crew of six, with three people going on EVA and three people staying back to help with EVA operations, initial missions on Mars can have a lot of unexpected situations. For e.g. need for a rescue mission, only one person in the EVA/airlock module. It is important that while each crew member has help, they are also independent and able to wear their own space suit with minimal help from the others. One big problem with the two piece suits is the alignment of the helmet

6. Have multiple ports of exit: Cabin depressurization is a big cause of concern on extra-terrestrial habitats, both on Mars and especially on the Moon. In case of cabin depressurization, sections of the Hab will be isolated using airlocks. When this happens it is still imperative that people in other sections of the Habitat are able to safely exit the Hab. While it is not possible to have all EVA equipment in all Hab modules, it is important to limit the number of people in domes at one time and have the adequate number of EVA equipment and an exit airlock in each module.

7. Check for consistency in equipment performance: For the first six EVAs, I calculated the drop in percentage per mile travelled by the rovers (see Table 1). We see that the rovers perform better at preserving battery for longer distances than they do for shorter EVAs.

Table 2: Drop in Percentage per Mile of Rovers for the First Six EVAs.

Drop in percentage per mile travelled.

Miles

Curiosity

Perseverance

Opportunity

Spirit

EVA 1

0.55

20

10.90909091

EVA 2

0.55

10.90909091

9.09090909

EVA 3

3

8

3.33333333

EVA 4

7.45

4.02684564

4.966442953

EVA 5

5.54

6.137184116

5.77617329

EVA 6

8.22

4.501216545

4.62287105

We can use this information to keep track of rover performance, and confidently estimate how much each individual rover can travel before it runs out of charge. Long term tracking of rover’s performance will also help astronauts determine whether a rover needs earlier maintenance or not.

8. Install methods for investigating software bugs: Crew 305 Valles used Astrolink to track the GPS coordinates of the crew while they are out on EVA. On one of the EVAs, the Astrolink software showed four trackers out instead of three. The Hab comms team communicated with the EVA crew if they had an extra-tracker (Astrolink 10) on them. Upon receiving a negative, the crew with the Mission Support established that Astrolink 10 was a digital artifact. Situations like these, however, would get increasingly confusing with a larger / independent crew. It is important to have methods for investigating software bugs (evaluating what the root cause is) like these and addressing them.

9. Practice concise comms: Currently, aviation pilots use very precise language to communicate with other pilots and the Air Traffic Controller. It is important to establish similar rules for communication

over comms such that everyone is heard clearly without any misinterpretation. Crew 305 progressively improved in their communication while in the Sim.

10. Understand your systems well: It took a while for Crew 305 to realize that the rovers read the total number of hours they have been operational rather than remaining range on the full charge. While the crew was able to accurately figure out in time what the rover reading said (and fortunately it did not lead to any accidents), it is important for the crew to understand the systems they are working with well – to avoid any mis-interpretations that could lead to mishandling data or equipment.

Design Requirements on Autonomy for future Martian Habitats:

1. Add following monitoring systems and add remote access to them in each Hab area. a. Battery charges

b. Power Generated by Solar Panels

c. Temperature Sensors for Generators and Fuel Cells

d. Voltmeters for Sequential Shunt Units

Our functionality models for the power systems revealed that it is important to have the following sensors to track performance of the power systems at any given time. The readings can be output to the Main Dome Computer Unit that tracks all other systems. This is important for both equipment performance tracking and smooth autonomous system integration.

2. Have a running inventory of the Hab and the different resources available.

3. Automate system transitions: 1) and 2) will allow smooth automated system transitions. While the MDRS has very active Mission Support to facilitate these transitions, Mars is not going to have Mission Support. Or the Mission Support will be 20 – 40 minute lag, and won’t be able to provide on-site services.

4. Have functional back up devices, that are structurally non-redundant: During the power outage, the Main Dome in Crew 305 relied on an igniter heater that did not rely on the electricity, but instead on propane. This kept the crew warm, even when the electric heating system didn’t work. This highlights that it is important to have back up devices that are functionally redundant, but not structurally redundant.

5. Organize resources and tools for ease of use: Figure 10 shows some of cabinet space organization in the Science Dome that house different equipment.
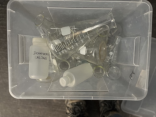
AD_4nXfCzVfJbYedE0ngDaWFv1VZKr6iVIk8dit9ZiyHY4ZDKNOKAmVA6nftensp-IPenEQj1kRmV3ytUB14IO8WCBaedodGSHOHXxMHCmbmb6CL6mGBLv3gVL57V2lDQ5fPnpHV1OxQiA?key=nXF6LhGPgVKlB_50n6BnRzoVAD_4nXd16a8Go6dXDzJVEXqoqV6OwmTOFk4Um1RDuhnuU7aG3yWlzvfBfznyIhbIWXoSbMPxILgZnYKtWtGJIZwpoi3FMfLxvwW6rcONZN22yN6zIub6-0th9CEXiH34vcjN0RvXCRt2GA?key=nXF6LhGPgVKlB_50n6BnRzoVAD_4nXegcw16NLRYvvsb8TC4Pdo_aDT0Ct02afu_mdFnB8z3Wpwrr2eaof3vZcwYRMLHN0LRqROv8oreSd4c6fjR8QjwcicLM-NmBqdGXARf8xRKYQI8NqCHNE8v8XCslOQ8kktyAJE8uA?key=nXF6LhGPgVKlB_50n6BnRzoVFigure 10: Cabinet Organization in Science Dome

While this setup is good for a human to work with. They will look around and find out what they need, it is too cumbersome for an autonomous system and will confuse them. Autonomous systems will need a cleaner organization to work efficiently. The best way to currently do this is to use a 3D printer, where you can create custom shelves and cabinets that autonomous systems can easily work around with.

Future work on this will include compiling a list of functionality models for all systems and components I documented at MDRS. These component functionality models will be used to create a digital extraterrestrial habitat model on the Control-Oriented Dynamic Computational Modeling Platform, where we can simulate different disruptions that will be present on Mars that cannot be simulated at MDRS either due to their absence (such as radiation) or for safety reasons.

7.

Title: Wearable-Based Autonomic Activity Profiles for Real-Time Cognitive Performance Monitoring in Spaceflight

Author(s): Peter Zoss

Description, activities, and results: This study will longitudinally quantify individual changes in autonomic nervous system (ANS) status via a wearable sensor in MDRS crew members to understand how our autonomic activity is associated with sequential measures of cognitive performance for predictive model development. Baseline data from the wearable devices will also be used to look at changes while living in analog isolation. The activities planned to be completed at MDRS included cognitive performance testing. This testing was scheduled to take place every other day starting from Sol 1 for a total of 6 testing sessions for each of the crew members.

This human factor project was able to get through all of its data collection period at MDRS. Cognitive performance testing has been completed for all crew members for the planned 6 tests at the MDRS. These tests occurred on Sols 1, 3, 5, 7, 9 and 11. The tests on Sol 3 had to end early due to power failure, resulting in an incomplete test for one crew member and a missed test for another. The cognitive performance test used is called the Cognition Test Battery, and it was administered to the crew via an iPad. The results from this research will be looked at further back in West Lafayette where analysis can be completed.
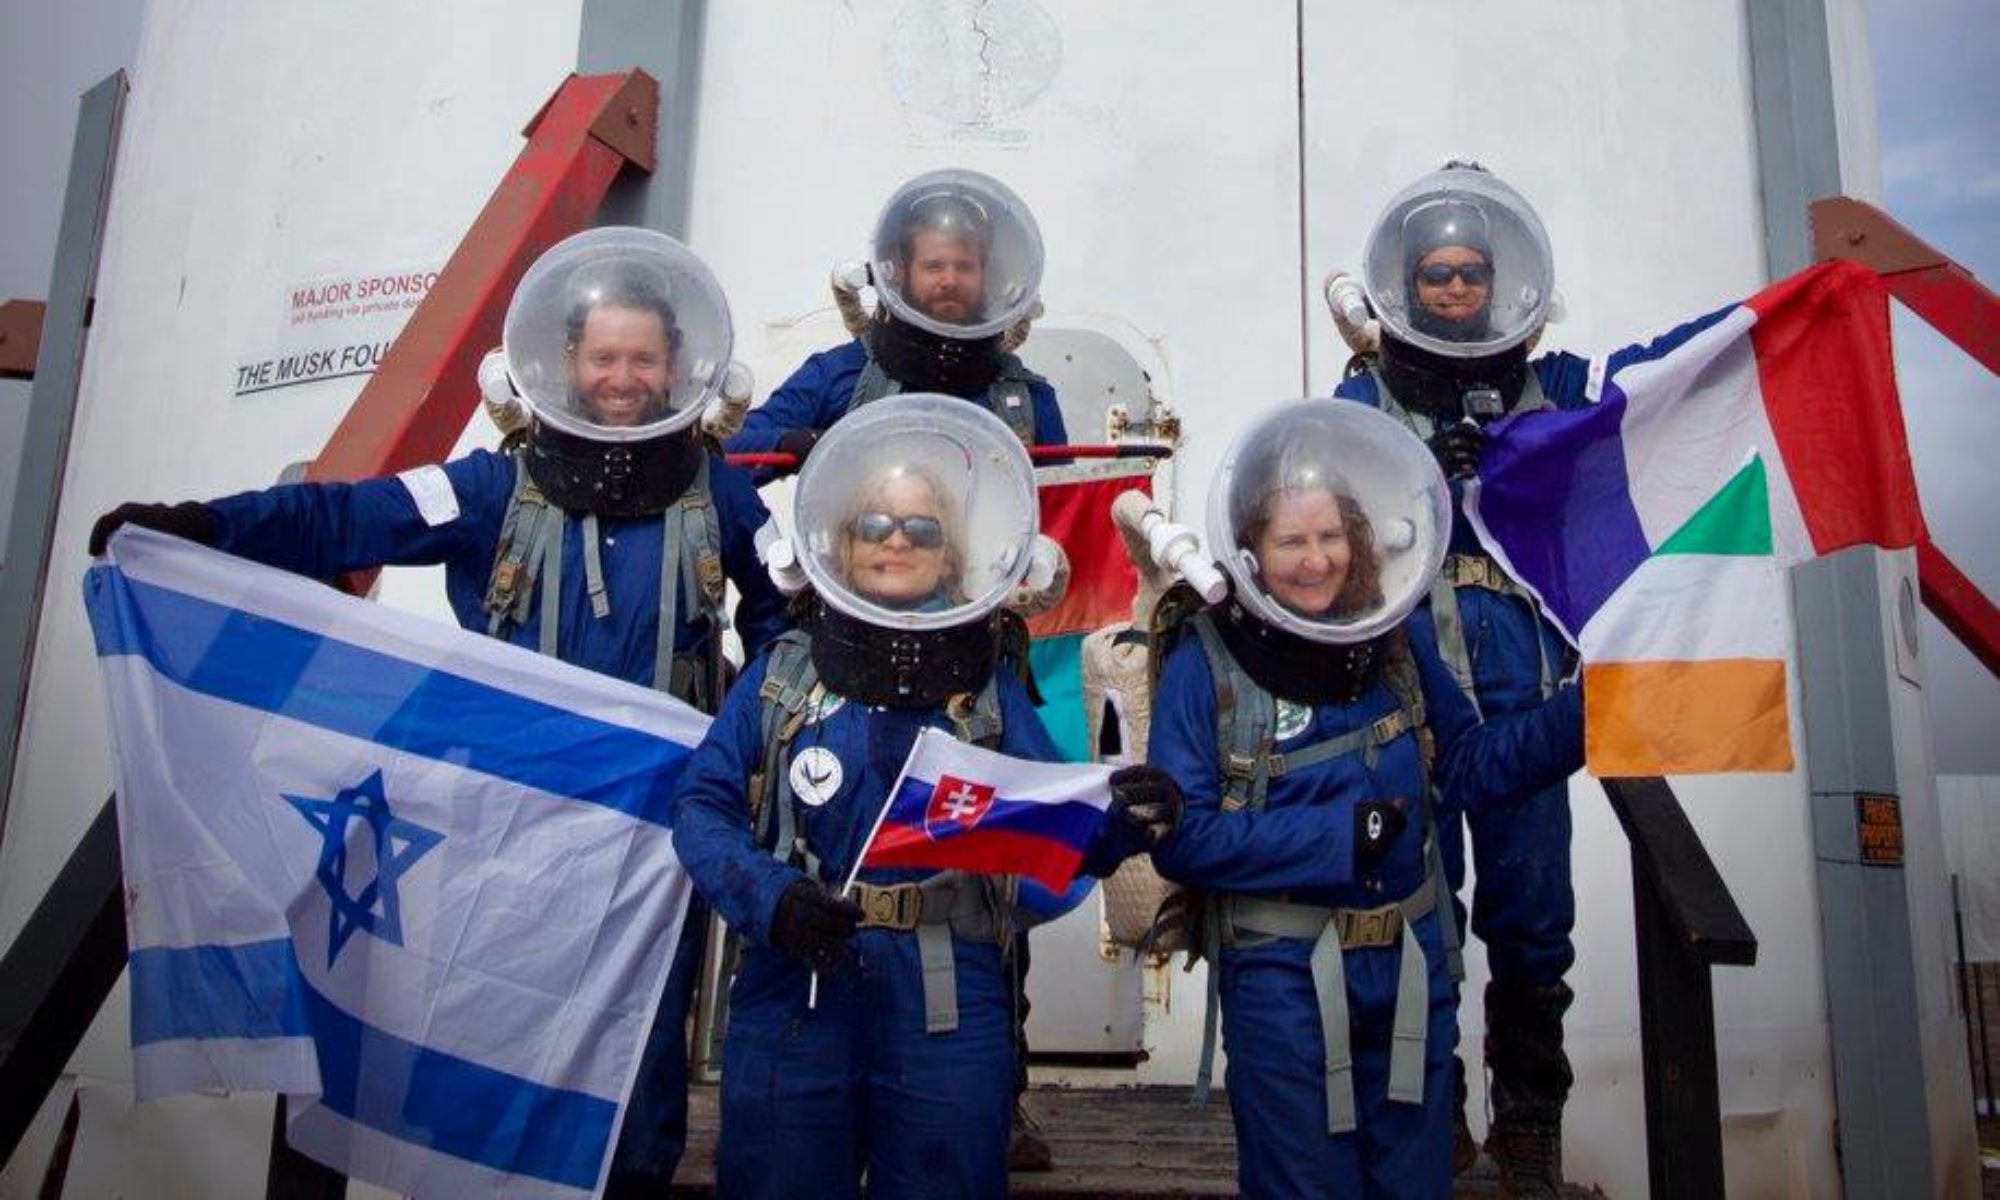
Operations Report – December 20th

Crew 305 Operations Report 20-12-2024
SOL:12
Name of person filing report: Spruha Vashi
Non-nominal systems: None!
Notes on non-nominal systems: None!
ROVERS
Spirit rover used: Yes
Hours: (before EVA): 259.1
Beginning charge: (Before EVA) 100
Ending charge: (On return from EVA, before recharging):74
Currently charging: Yes
Opportunity rover used: No
Curiosity rover used: No
Perseverance rover used: Yes
Hours: (before EVA): 296.8
Beginning charge: (Before EVA) 100
Ending charge: (On return from EVA, before recharging):68
Currently charging: Yes
General notes on rovers: None.
Summary of Hab operations: Operations were standard.
Water Use (please use both methods to estimate water usage)
Time of measurements: 3pm
1) Per formula:19.6075 gallons
2) Smart Home Dashboard: 20.19 gallons
Water (static tank, remaining gallons):285.3323
Static tank pipe heater (on or off): On
Static tank heater (on or off): On
Toilet tank emptied (no or yes): No
Summary of internet: No internet issues
Summary of suits and radios: Suit #3 cable was fixed, thank you for the notes on fixing issues.
Summary of GreenHab operations: No major greenhab operations, Hunter spent some time harvesting and checking on the crops.
WATER USE: 6 gallons
Heater (On or Off): On
Supplemental light (hours of operation): 5-10pm
Harvest (name, weight in grams): Cucumber, 76 grams (was harvested after the Greenhab report was sent so was not mentioned there)
Summary of Science Dome operations: No science dome operations.
Dual split (Heat or AC, On or Off): Automatic functions running.
Summary of RAM operations: No operations.
Summary of any observatory issues: No issues.
Summary of health and safety issues: No issues.
Questions, concerns and requests to Mission Support: Thank you to mission support for all the assistance throughout the mission!

GreenHab Report – December 20th

Crew 305 GreenHab Report 20Dec2024

GreenHab Officer: Hunter Vannier

Environmental control (fan & heater): Heater and fan on automatically.

Average temperatures (last 24h): 87 F

Maximum temperature (last 24h): 95 F

Minimum temperature (last 24h): 80.1 F

Hours of supplemental light: 1700 – 2200

Daily water usage for crops: 10 gallons

Daily water usage for research and/or other purposes: none

Water in Blue Tank (200-gallon capacity): 109.75 gallons

Time(s) of watering for crops: 9:15 am, 4:16 pm

Changes to crops: none

Narrative: It is my final day in the GreenHab and everything is looking healthy. There are a lot of cucumbers growing and even the first cherry tomatoes appeared! I hope the following crews appreciate them. I thoroughly watered all of the plants which is why the consumption is higher today, and I disassembled my experiment.

Harvest: none

Support/supplies needed: none

EVA Report – December 20th

Crew 305 EVA Report 20-12-2024

EVA # 12

Author: Ian Pamerleau

Purpose of EVA: Sand Sample and stream width measurements around Compass Rock.

Start time: 10:00 hr

End time: 11:40 hr

Narrative: Ian led the EVA accompanied by Monish and Hunter. Perseverance and Spirit started the EVA with 296.8 hr and 259.1 hr, respectively and each with 100% battery. We took the rovers north to Galileo Road and out to Compass Rock, where we dismounted. We noticed a lot of pieces of petrified wood on the ground on our way to the streams on the eastern side of the monument. We wanted to find two small streams that met and ran south towards the larger flow into Candor Chasma. Both streams were easy to find, and we were able to safely get into the small canyon they cut out of the landscape. There were many tracks from fauna in the area, and Hunter caught a bunny running into a tight overhang as we approached part of one of the streams. As we moved south down the larger flow, Hunter was able to find a large patch of cryptobiotic soil next to the stream. We took a measurement not far from this location as well as a sand sample for later analysis. After three width measurements and a sample collection, we headed back to the rovers. We considered trying to stop and find the lost camera from EVA 08, but we did not have time and headed straight back to the Hab. At the end of the EVA, Perseverance was at 297.1 hr and 68%, and Spirit was at 259.5 hr and 74%.

Destination: Compass Rock

Coordinates (use UTM WGS 84): 520250E, 4251800N

Participants: Ian Pamerleau, Monish Lokhande, Hunter Vannier

Road(s) and routes per MDRS Map: MDRS driveway, Cow Dung Road North to Galileo Road until Compass Rock.

Mode of travel: Rovers (Perseverance and Spirit)

Copyright © The Mars Society. All rights reserved. | Main Site